| | Ranking (Final) | Cotação | Setor | Subsetor | Segmento | Ranking (Graham) | Ranking (Bazin) | Ranking (Greenblatt) | Ranking (Piotroski) | Ranking (Sum) | Preço Justo (Graham) | Preço Justo (Bazin) | Graham Score | Bazin Score | Piotroski Score | Preço Justo (Graham) / Cotação | Preço Justo (Bazin) / Cotação | Media de Dividend Yield dos Últimos 5 anos | Dividend Yield | P/L | P/VP | PSR | P/Ativo | P/Capital de Giro | P/EBIT | P/ACL | EV/EBIT | EV/EBITDA | Margem Ebit | Margem Líquida | Liquidez Corrente | ROIC | ROE | Liquidez 2 meses | Patrimônio Líquido | Dívida Bruta/Patrimônio | Crescimento em 5 anos | CAGR Lucros 5 Anos | CAGR Receitas 5 Anos | Dívida Líquida/Patrimônio | Dívida Líquida/EBIT | ROA | Patrimonio/Ativos | Giro Ativos | Margem Bruta | Passivo/Ativo | Liquidez Média Diária | 10 Anos de Sobrevivencia
Victor Cordeiro Costa Victorcorcos
| Papel | Empresa | Tipo | Score | Cotação | 2022 | 2023 | 2024 | 2025 | Average Yield (5Y) | DPA (year 01) | DPA (year 02) | DPA (year 03) | DPA (year 04) | DPA (year 05) | DPA (year 06) | DPA (year 07) | DPA (year 08) | DPA (year 09) | DPA (year 10) | DPA (year 11) | DPA (year 12) | DPA (year 13) | DPA (year 14) | DPA (year 15) | DPA (year 16) | DPA (year 17) | Median Yield (5Y) | Mediana DY | Média DY | Ranking | Setor | Subsetor | Últ balanço processado | P/L | P/VP | PSR | P/Cap. Giro | P/EBIT | P/Ativ Circ Liq | P/Ativos | EV / EBIT | EV/EBIT | EV / EBITDA | L/P | Div. Yield | Payout | LPA | VPA | DPA | Marg. Bruta | Marg. EBIT | Marg. Líquida | ROE | ROIC | ROTC | ROA | ROCE | Dív.Brut/ Patrim. | Div Liq/ Patrimônio Líquido | Div Br/ Ativo | Div Liq/ EBIT | Dív. Bruta | Dív. Líquida | Cres. Rec (5a) | Receita Líquida | Receita Líquida Trimestral | EBIT | EBIT Trimestral | Lucro Líquido | Lucro Líquido Trimestral | EBIT / Ativo | Disponibilidades | Patrim. Líq | Liquidez Corr | Capital de Giro | Giro At
| Papel | Empresa | Tipo | Score | Cotação | 2022 | 2023 | 2024 | 2025 | Average Yield (5Y) | Median Yield (5Y) | Ranking | Setor | Subsetor | Últ balanço processado | P/L | P/VP | PSR | P/Cap. Giro | P/EBIT | P/Ativ Circ Liq | P/Ativos | EV / EBIT | EV/EBIT | EV / EBITDA | L/P | Div. Yield | Payout | LPA | VPA | DPA | Marg. Bruta | Marg. EBIT | Marg. Líquida | ROE | ROIC | ROTC | ROA | ROCE | Dív.Brut/ Patrim. | Div Liq/ Patrimônio Líquido | Div Br/ Ativo | Div Liq/ EBIT | Dív. Bruta | Dív. Líquida | Cres. Rec (5a) | Receita Líquida | Receita Líquida Trimestral | EBIT | EBIT Trimestral | Lucro Líquido | Lucro Líquido Trimestral | EBIT / Ativo | Disponibilidades | Patrim. Líq | Liquidez Corr | Capital de Giro | Giro Ativos | Ativo | Ativo Circulante | Passivo Circulante | Valor da firma | Valor de mercado | Nro. Ações | Vol $ méd (2m) | Depósitos | Cart. de Crédito | Result Int Financ | Result Int Financ Trimestral | Rec Serviços | Rec Serviços Trimestral | Data últ cot | Min 52 sem | Max 52 sem | Oscilação -

Os blocos devem ter boas descrições explicando os comportamentos, seguindo os princípios de Behavior Driven Development (BDD).
Além disso, o código de teste deve ser organizado semanticamente dentro do bloco apropriado com base nesta regra:
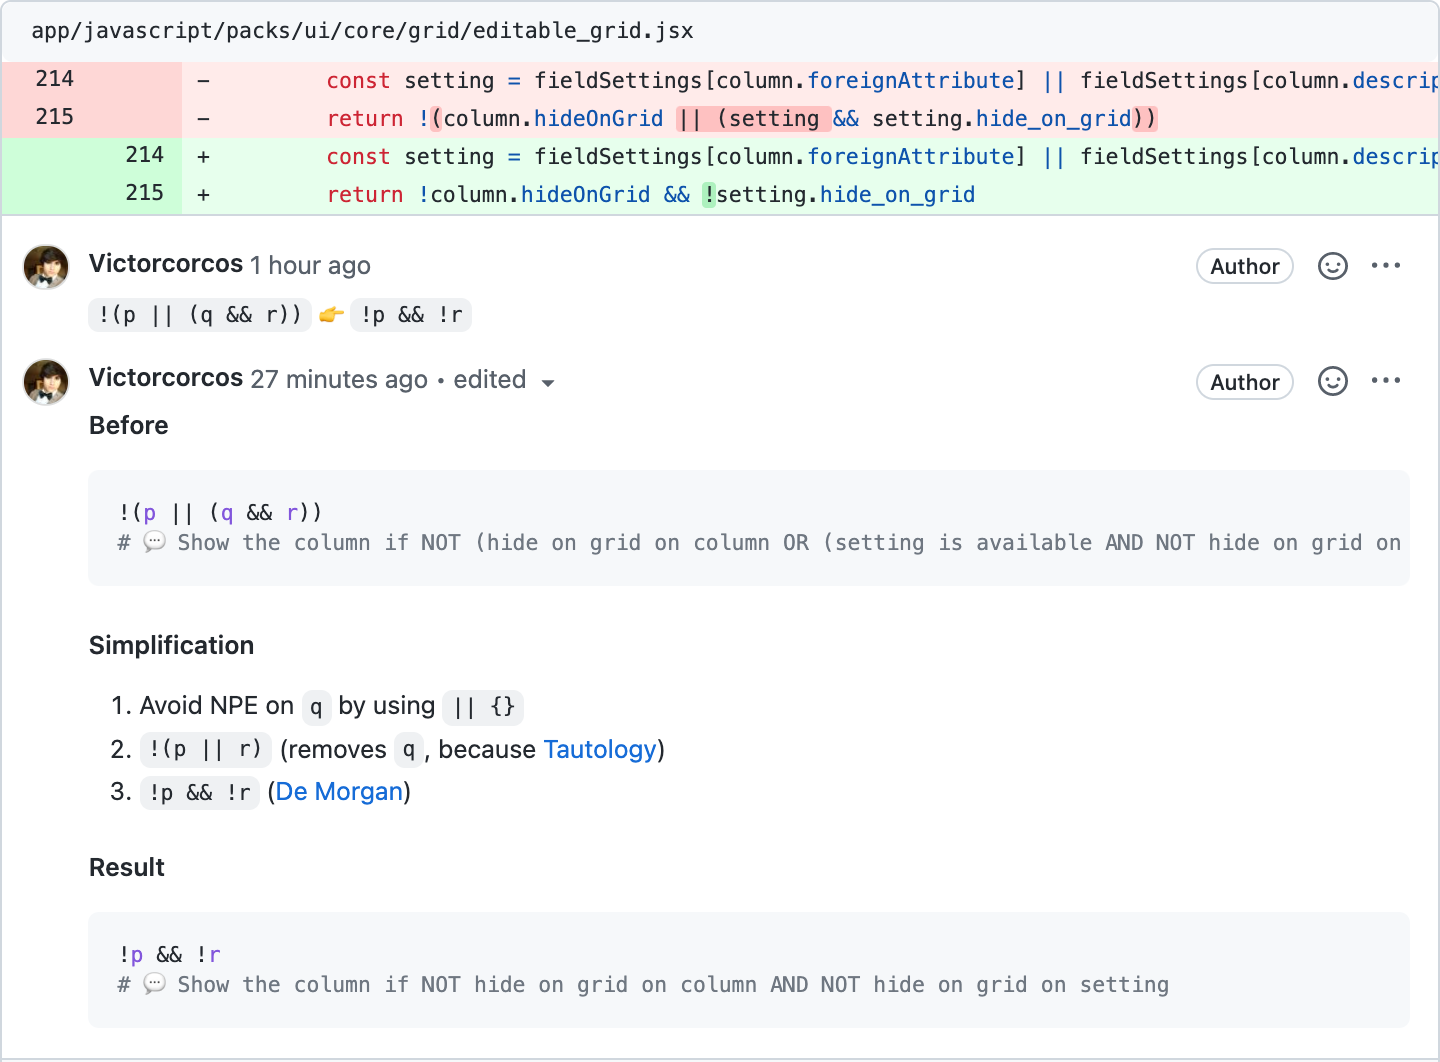
You can always turn a complex conditional into a simpler one through the Propositional Logic rules
- References
This table provides optimal training settings for LoRA fine-tuning based on the number of training images.
| # of Images | Network Rank (network_dim) |
Repeats | Epochs | Batch Size | Network Alpha (alpha) |
|---|---|---|---|---|---|
| ≤ 50 | 8~16 |
7~10 |
15~20 |
2~4 |
Rank / 2 (e.g., 16/8) |
| 50~100 | 16 |
6~8 |
12~18 |
4 |
Rank / 2 (e.g., 16/8) |
Below is a comprehensive list of all foods in Don’t Starve Together with their stats. The Score column represents a cost-benefit analysis based on the food’s overall value considering its stats and how easy it is to obtain.
| Food Item | Hunger | Health | Sanity | Recipe/Source | Score (Cost Benefit) |
|---|---|---|---|---|---|
| Berries | 12.5 | 0 | 0 | Berry Bushes | 7/10 - Very accessible |
| Roasted Berries | 12.5 | 1 | 0 | Cook Berries | 7/10 - Easy to mass produce |