Created
November 19, 2018 10:54
-
-
Save VidyasagarMSC/f98f44740862eba23ef6e7ae41f65842 to your computer and use it in GitHub Desktop.
This file contains hidden or bidirectional Unicode text that may be interpreted or compiled differently than what appears below. To review, open the file in an editor that reveals hidden Unicode characters.
Learn more about bidirectional Unicode characters
| { | |
| "nbformat_minor": 1, | |
| "cells": [ | |
| { | |
| "execution_count": 40, | |
| "cell_type": "code", | |
| "metadata": {}, | |
| "outputs": [ | |
| { | |
| "output_type": "stream", | |
| "name": "stdout", | |
| "text": "retrieved_url => https://www.ibm.com/us-en/\nlanguage => en\nusage => {'features': 1, 'text_units': 1, 'text_characters': 1536}\nkeywords => [{'sentiment': {'score': 0.792454}, 'relevance': 0.864624, 'count': 3, 'emotions': {'joy': 0.522781, 'sadness': 0.188625, 'fear': 0.12012, 'disgust': 0.103212, 'anger': 0.106669}, 'text': 'curated online courses'}, {'sentiment': {'score': 0.664726}, 'relevance': 0.864593, 'count': 1, 'emotions': {'joy': 0.532354, 'sadness': 0.265225, 'fear': 0.07773, 'disgust': 0.090112, 'anger': 0.102242}, 'text': 'free virtual server'}]\n" | |
| }, | |
| { | |
| "execution_count": 40, | |
| "metadata": {}, | |
| "data": { | |
| "text/html": "<div>\n<style scoped>\n .dataframe tbody tr th:only-of-type {\n vertical-align: middle;\n }\n\n .dataframe tbody tr th {\n vertical-align: top;\n }\n\n .dataframe thead th {\n text-align: right;\n }\n</style>\n<table border=\"1\" class=\"dataframe\">\n <thead>\n <tr style=\"text-align: right;\">\n <th></th>\n <th>count</th>\n <th>emotions.anger</th>\n <th>emotions.disgust</th>\n <th>emotions.fear</th>\n <th>emotions.joy</th>\n <th>emotions.sadness</th>\n <th>relevance</th>\n <th>sentiment.score</th>\n <th>text</th>\n </tr>\n </thead>\n <tbody>\n <tr>\n <th>0</th>\n <td>3</td>\n <td>0.106669</td>\n <td>0.103212</td>\n <td>0.12012</td>\n <td>0.522781</td>\n <td>0.188625</td>\n <td>0.864624</td>\n <td>0.792454</td>\n <td>curated online courses</td>\n </tr>\n <tr>\n <th>1</th>\n <td>1</td>\n <td>0.102242</td>\n <td>0.090112</td>\n <td>0.07773</td>\n <td>0.532354</td>\n <td>0.265225</td>\n <td>0.864593</td>\n <td>0.664726</td>\n <td>free virtual server</td>\n </tr>\n </tbody>\n</table>\n</div>", | |
| "text/plain": " count emotions.anger emotions.disgust emotions.fear emotions.joy \\\n0 3 0.106669 0.103212 0.12012 0.522781 \n1 1 0.102242 0.090112 0.07773 0.532354 \n\n emotions.sadness relevance sentiment.score text \n0 0.188625 0.864624 0.792454 curated online courses \n1 0.265225 0.864593 0.664726 free virtual server " | |
| }, | |
| "output_type": "execute_result" | |
| } | |
| ], | |
| "source": "import pandas as pd\nfrom pandas.io.json import json_normalize\nimport json\n\n\njsoninput = {\n \"usage\": {\n \"text_units\": 1,\n \"text_characters\": 1536,\n \"features\": 1\n },\n \"keywords\": [\n {\n \"text\": \"curated online courses\",\n \"count\": 3,\n \"sentiment\": {\n \"score\": 0.792454\n },\n \"relevance\": 0.864624,\n \"emotions\": {\n \"sadness\": 0.188625,\n \"joy\": 0.522781,\n \"fear\": 0.12012,\n \"disgust\": 0.103212,\n \"anger\": 0.106669\n }\n },\n {\n \"text\": \"free virtual server\",\n \"count\": 1,\n \"sentiment\": {\n \"score\": 0.664726\n },\n \"relevance\": 0.864593,\n \"emotions\": {\n \"sadness\": 0.265225,\n \"joy\": 0.532354,\n \"fear\": 0.07773,\n \"disgust\": 0.090112,\n \"anger\": 0.102242\n }\n }\n ],\n \"language\": \"en\",\n \"retrieved_url\": \"https://www.ibm.com/us-en/\"\n}\n\nfor key,val in jsoninput.items():\n print(key, \"=>\", val)\nmydata = json_normalize(jsoninput['keywords'])\nmydata.head(3)" | |
| }, | |
| { | |
| "execution_count": 74, | |
| "cell_type": "code", | |
| "metadata": {}, | |
| "outputs": [ | |
| { | |
| "execution_count": 74, | |
| "metadata": {}, | |
| "data": { | |
| "text/html": "<div>\n<style scoped>\n .dataframe tbody tr th:only-of-type {\n vertical-align: middle;\n }\n\n .dataframe tbody tr th {\n vertical-align: top;\n }\n\n .dataframe thead th {\n text-align: right;\n }\n</style>\n<table border=\"1\" class=\"dataframe\">\n <thead>\n <tr style=\"text-align: right;\">\n <th></th>\n <th>text</th>\n <th>count</th>\n </tr>\n </thead>\n <tbody>\n <tr>\n <th>0</th>\n <td>curated online courses</td>\n <td>3</td>\n </tr>\n <tr>\n <th>1</th>\n <td>free virtual server</td>\n <td>1</td>\n </tr>\n </tbody>\n</table>\n</div>", | |
| "text/plain": " text count\n0 curated online courses 3\n1 free virtual server 1" | |
| }, | |
| "output_type": "execute_result" | |
| } | |
| ], | |
| "source": "NLU_df = pd.DataFrame(mydata, columns=['text', 'count'])\nNLU_df" | |
| }, | |
| { | |
| "execution_count": 79, | |
| "cell_type": "code", | |
| "metadata": {}, | |
| "outputs": [ | |
| { | |
| "execution_count": 79, | |
| "metadata": {}, | |
| "data": { | |
| "text/html": "<iframe id=\"igraph\" scrolling=\"no\" style=\"border:none;\" seamless=\"seamless\" src=\"https://plot.ly/~aficionadovmac/6.embed\" height=\"525px\" width=\"100%\"></iframe>", | |
| "text/plain": "<plotly.tools.PlotlyDisplay object>" | |
| }, | |
| "output_type": "execute_result" | |
| } | |
| ], | |
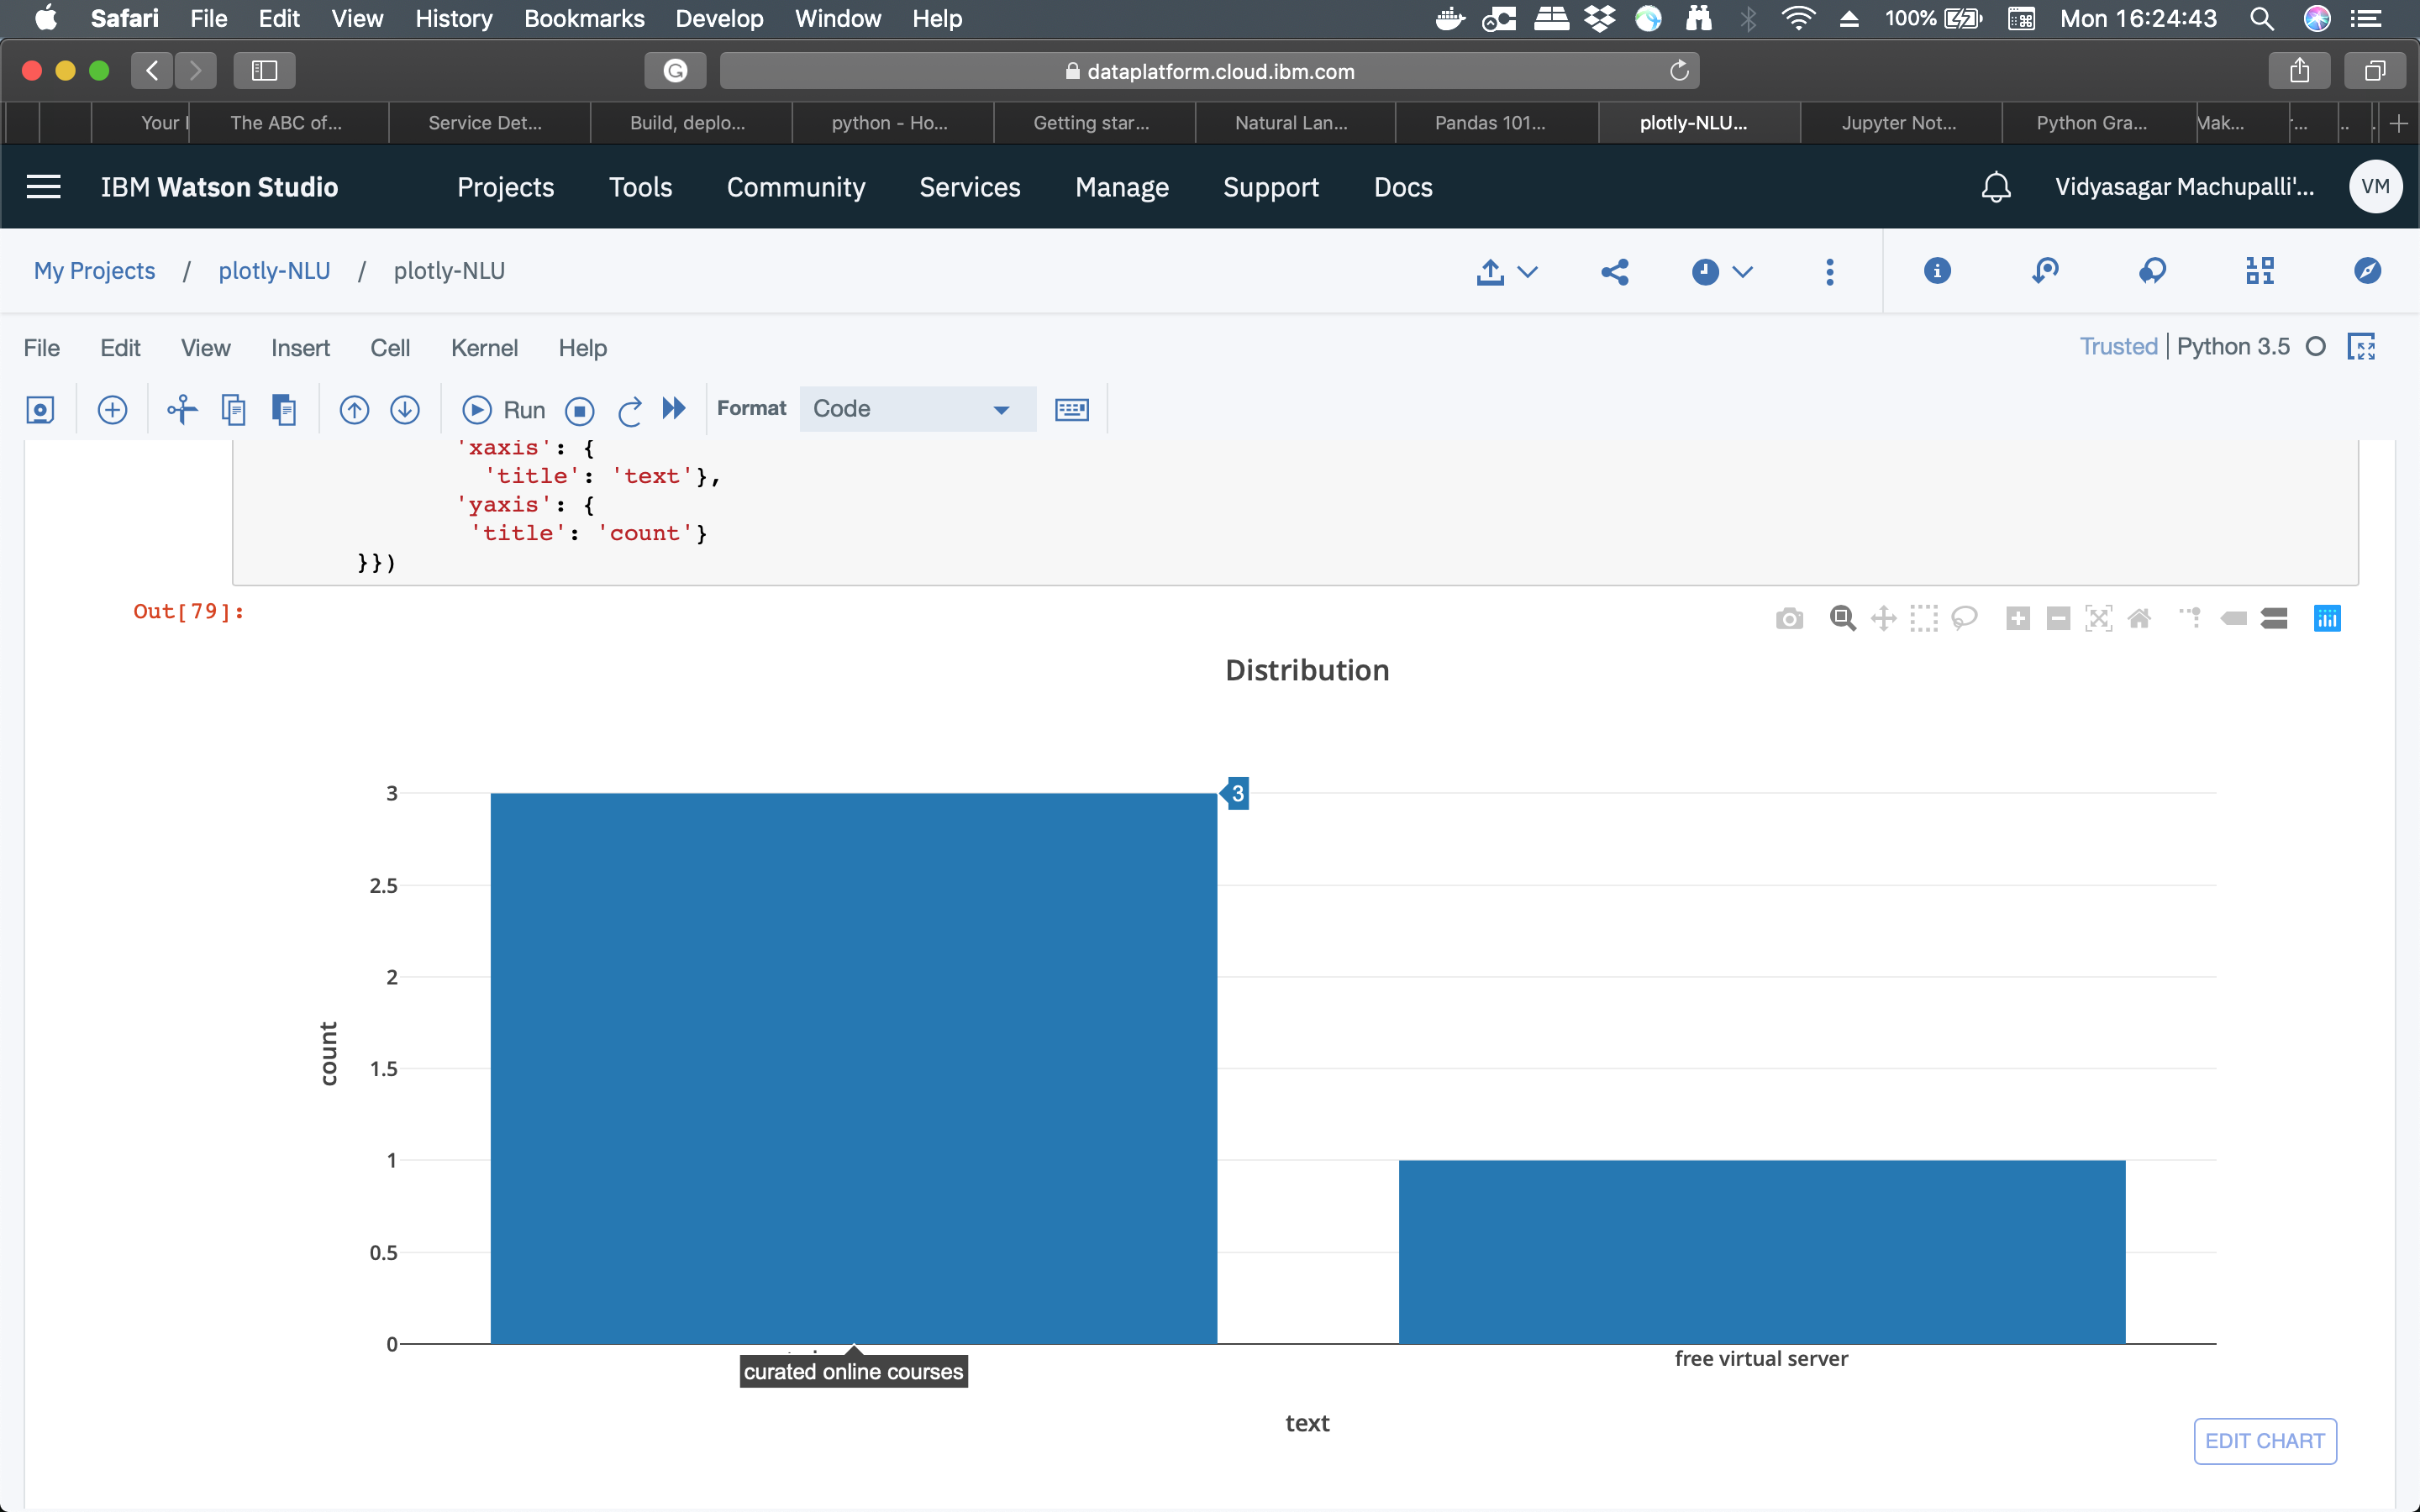
| "source": "import plotly\nimport plotly.plotly as py\nimport plotly.graph_objs as go\n\nNLU_data = [go.Bar(x=NLU_df.text, y=NLU_df['count'].tolist())]\n\npy.iplot({ 'data': NLU_data,\n 'layout': {\n 'title': 'Distribution',\n 'xaxis': {\n 'title': 'text'},\n 'yaxis': {\n 'title': 'count'}\n }})" | |
| }, | |
| { | |
| "execution_count": null, | |
| "cell_type": "code", | |
| "metadata": {}, | |
| "outputs": [], | |
| "source": "" | |
| } | |
| ], | |
| "metadata": { | |
| "kernelspec": { | |
| "display_name": "Python 3.5", | |
| "name": "python3", | |
| "language": "python" | |
| }, | |
| "language_info": { | |
| "mimetype": "text/x-python", | |
| "nbconvert_exporter": "python", | |
| "version": "3.5.5", | |
| "name": "python", | |
| "file_extension": ".py", | |
| "pygments_lexer": "ipython3", | |
| "codemirror_mode": { | |
| "version": 3, | |
| "name": "ipython" | |
| } | |
| } | |
| }, | |
| "nbformat": 4 | |
| } |
Sign up for free
to join this conversation on GitHub.
Already have an account?
Sign in to comment
Plotted Bar chart
