Chrome's profiler ("Performance tab) is very useful for measuring JavaScript performance, but what if you want to measure the performance of a custom extension?
For example, what if I would like to profile the following interaction:
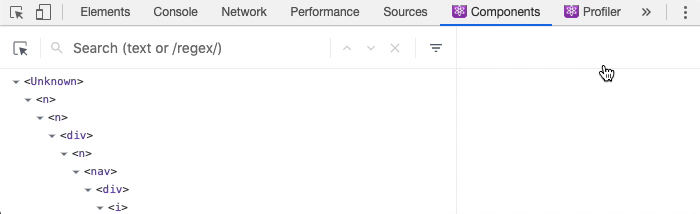

Chrome's profiler ("Performance tab) is very useful for measuring JavaScript performance, but what if you want to measure the performance of a custom extension?
For example, what if I would like to profile the following interaction:
| using namespace std; | |
| #include <bits/stdc++.h> | |
| #define trace(x) cout<<#x<<": "<<x<<" "; | |
| int solve(string s, int n, int k) | |
| { | |
| if(n == 0) | |
| return s[k]; | |
| int skip = k/((int)pow(2, n)); |
Note
to active Office without crack, just follow https://github.com/WindowsAddict/IDM-Activation-Script,
you wiil only need to run
irm https://massgrave.dev/ias | iex| // one way searching through italics tag | |
| x = document.getElementsByTagName('i'); | |
| x[0].innerText // ==> it will give you correct output | |
| // searching through class | |
| x = document.getElementsByClassName('spell'); | |
| x[1].children[0].textContent // ==> it will give same result too. | |
| // This works for links like https://www.google.co.in/search?q=summr | |
| // Gives an output summer |
| # Generate a new pgp key: (better to use gpg2 instead of gpg in all below commands) | |
| gpg --gen-key | |
| # maybe you need some random work in your OS to generate a key. so run this command: `find ./* /home/username -type d | xargs grep some_random_string > /dev/null` | |
| # check current keys: | |
| gpg --list-secret-keys --keyid-format LONG | |
| # See your gpg public key: | |
| gpg --armor --export YOUR_KEY_ID | |
| # YOUR_KEY_ID is the hash in front of `sec` in previous command. (for example sec 4096R/234FAA343232333 => key id is: 234FAA343232333) |
| #!/bin/bash | |
| for file in $(find . -type f); | |
| do | |
| git blame --date=format:%Y%m%d $file | |
| done | sed -e 's/.*\s\([0-9]\{8\}\)\s.*/\1/' | sort -r | tail |