Keywords: color-space HUSL HSLuv CIELCh CIELuv CIELab max-chroma everyone-knows
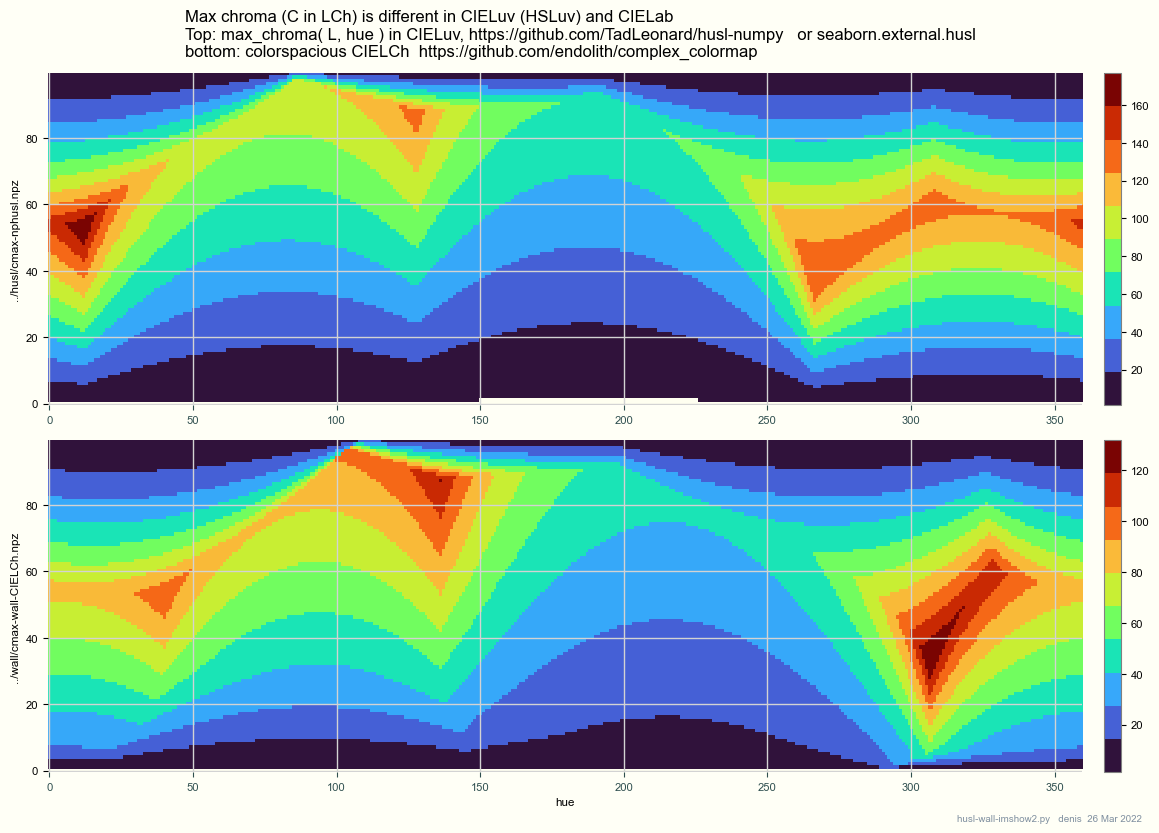
Whenever something can be done in two ways, someone will be confused.
There are two quite different color spaces: \
#!/usr/bin/env python3 | |
""" Usage: | |
python3 ssquery.py '(posdef == 1) & (1000 <= rows <= 20000)' posdef.csv | |
reads http://sparse.tamu.edu/files/ssstats.csv | |
queries it | |
writes "posdef.csv" like | |
# SuiteSparse posdef & (1000 <= rows <= 20000) | |
id,group,name,rows,cols,nnz,real,bool,is2d3d,posdef,symm,nsymm,kind | |
29156,Boeing,msc01050,1050,1050,26198,1,0,1,1,1.0,1.0,structural |
Keywords: wind power, Germany, python, globalwindatlas
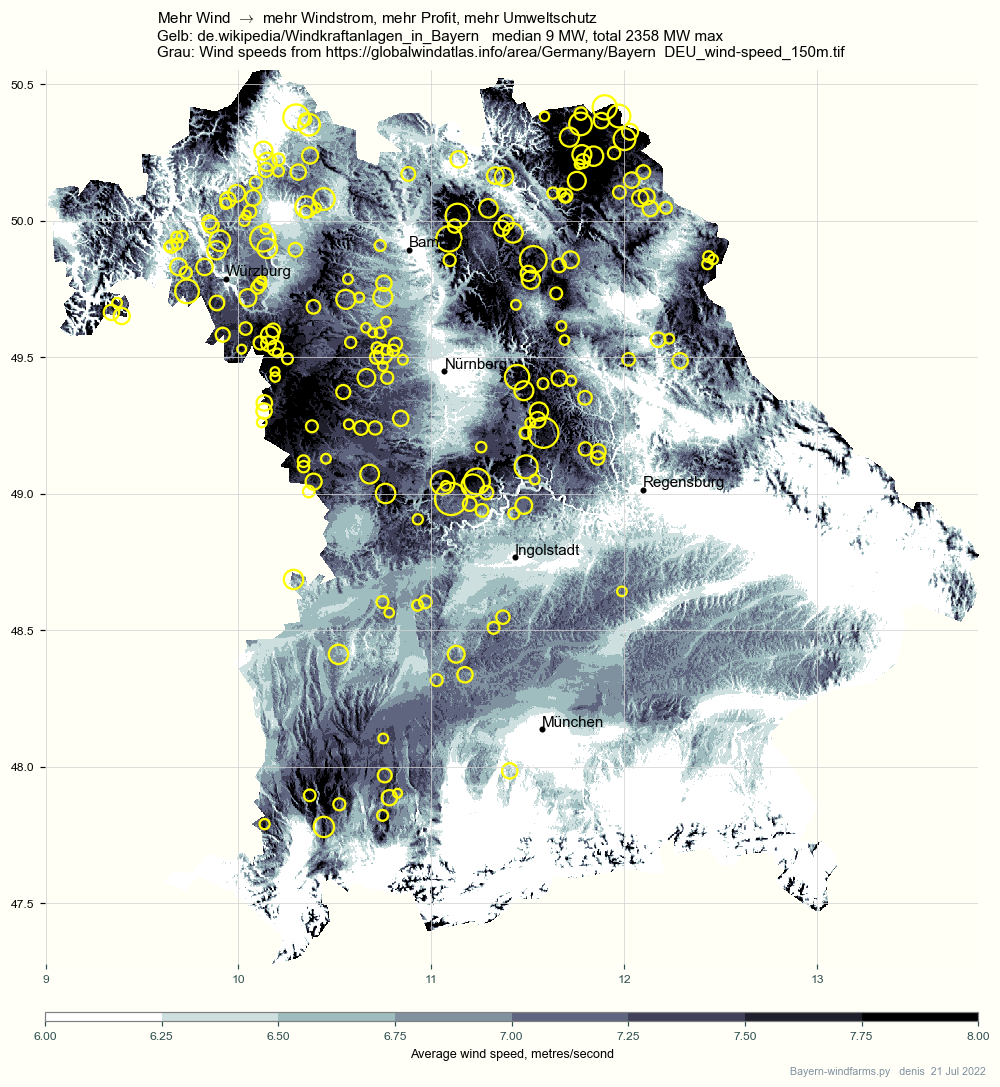
Purpose: collect data on wind farms in Germany in a single .csv file, from https://de.wikipedia.org/wiki/Liste_von_Windkraftanlagen_in_Bayern etc.
The file windfarms-in-Germany.csv
looks like this:
MW MW/Rad Nrad Year N E Land Lkr Typ Ort
Keywords: image raster resize rescale reproject Manhattan-grid regular-grid
We have a picture (image, raster) A, an array of colored pixels,
and want to warp it to a new picture O of a different size or shape.
Examples:
Map projection, flat maps <-> globe;
Image scaling.
There are hundreds of cases of these, and zillions of programs
Keywords: rioxarray, rasterio, reproject, geotiff, testcase
This plot shows that rioxarray reproject UTM -> 4326, middle -> right, widens NaNs at the sides:
Keywords: electricity, Germany, renewable, wind, python, pandas
Purpose: summarize data on electricity sources in Germany from the electricity market site smard.de:
total 502489 GWh 365 days, 2020-07-01 .. 2021-06-30:
GWh % GW
Braunkohle 96253.2 19.2 11.0
#!/usr/bin/env python3 | |
""" https://www.rki.de/DE/Content/InfAZ/N/Neuartiges_Coronavirus/Daten/Fallzahlen_Kum_Tab.html .xlsx | |
-> python pandas read_excel | |
""" | |
# sheets, from openpyxl -- | |
# 0 Erlaeuterungen 20 rows 1 cols | |
# 1 Fälle-Todesfälle-gesamt 509 rows 16384 cols ?! | |
# 2 BL_7-Tage-Fallzahlen (fixiert) 39 rows 396 cols | |
# 3 BL_7-Tage-Inzidenz (fixiert) 21 rows 396 cols | |
# 4 LK_7-Tage-Fallzahlen (fixiert) 419 rows 207 cols |
Keywords: sparse linear solver, python, scipy, testcase, matrix, GMRES, poisson, plot
Wikipedia GMRES says
Keywords, tags: linear programming, benchmark, Mittelmann, HiGHS, python, scipy, sparse-matrix
This plot shows the runtimes of various LP interior-point and simplex programs on Mittelmann's benchmark problems.
To plot similar rows / similar columns near each other,