Look at LSB init scripts for more information.
Copy to /etc/init.d:
# replace "$YOUR_SERVICE_NAME" with your service's name (whenever it's not enough obvious)Look at LSB init scripts for more information.
Copy to /etc/init.d:
# replace "$YOUR_SERVICE_NAME" with your service's name (whenever it's not enough obvious)This a collection of notes and files used in my quest to create "Reboot to Windows" and "Reboot to Linux" scripts (and desktop shortcuts) for Linux and Windows respectively that automatically reboot my system and instruct rEFInd to auto-select the appropriate OS entry.
The key for achieving this is to modify the EFI Variable PreviousBoot with GUID 36d08fa7-cf0b-42f5-8f14-68df73ed3740, which rEFInd uses to store the last entry selected in the menu and, if using the + default entry, will be used to select the default OS. By doing this, we trick rEFInd into booting the OS we choose without having to be physically there to press the keyboard.
| ALERT deleted_container_rate_on_hosts | |
| IF sum without(instance) (rate(engine_daemon_container_actions_seconds_count{action="delete"}[1m])) > 0.1 | |
| FOR 1m | |
| ANNOTATIONS { | |
| summary = "DELETED CONTAINER RATE WARNING ON '{{ $labels.instance }}'", | |
| description = "{{ $labels.instance }} has a HIGH rate of deleted containers. Deleted container rate is {{ humanize $value}}%.", | |
| } |
This gist will show how to setup Raspbian Stretch as a headless Bluetooth A2DP audio sink. This will allow your phone, laptop or other Bluetooth device to play audio wirelessly through a Rasperry Pi.
A quick search will turn up a plethora of tutorials on setting up A2DP on the Raspberry Pi. However, I felt this gist was necessary because this solution is:
| df -hi | |
| apt install jq | |
| cd /var/lib/docker/overlay2/ | |
| find . -xdev -type f | cut -d "/" -f 2 | sort | uniq -c | sort -n | |
| docker inspect $(docker ps -qa) | jq -r 'map([.Name, .GraphDriver.Data.MergedDir]) | .[] | "\(.[0])\t\(.[1])"' | |
| docker ps | |
| docker images |
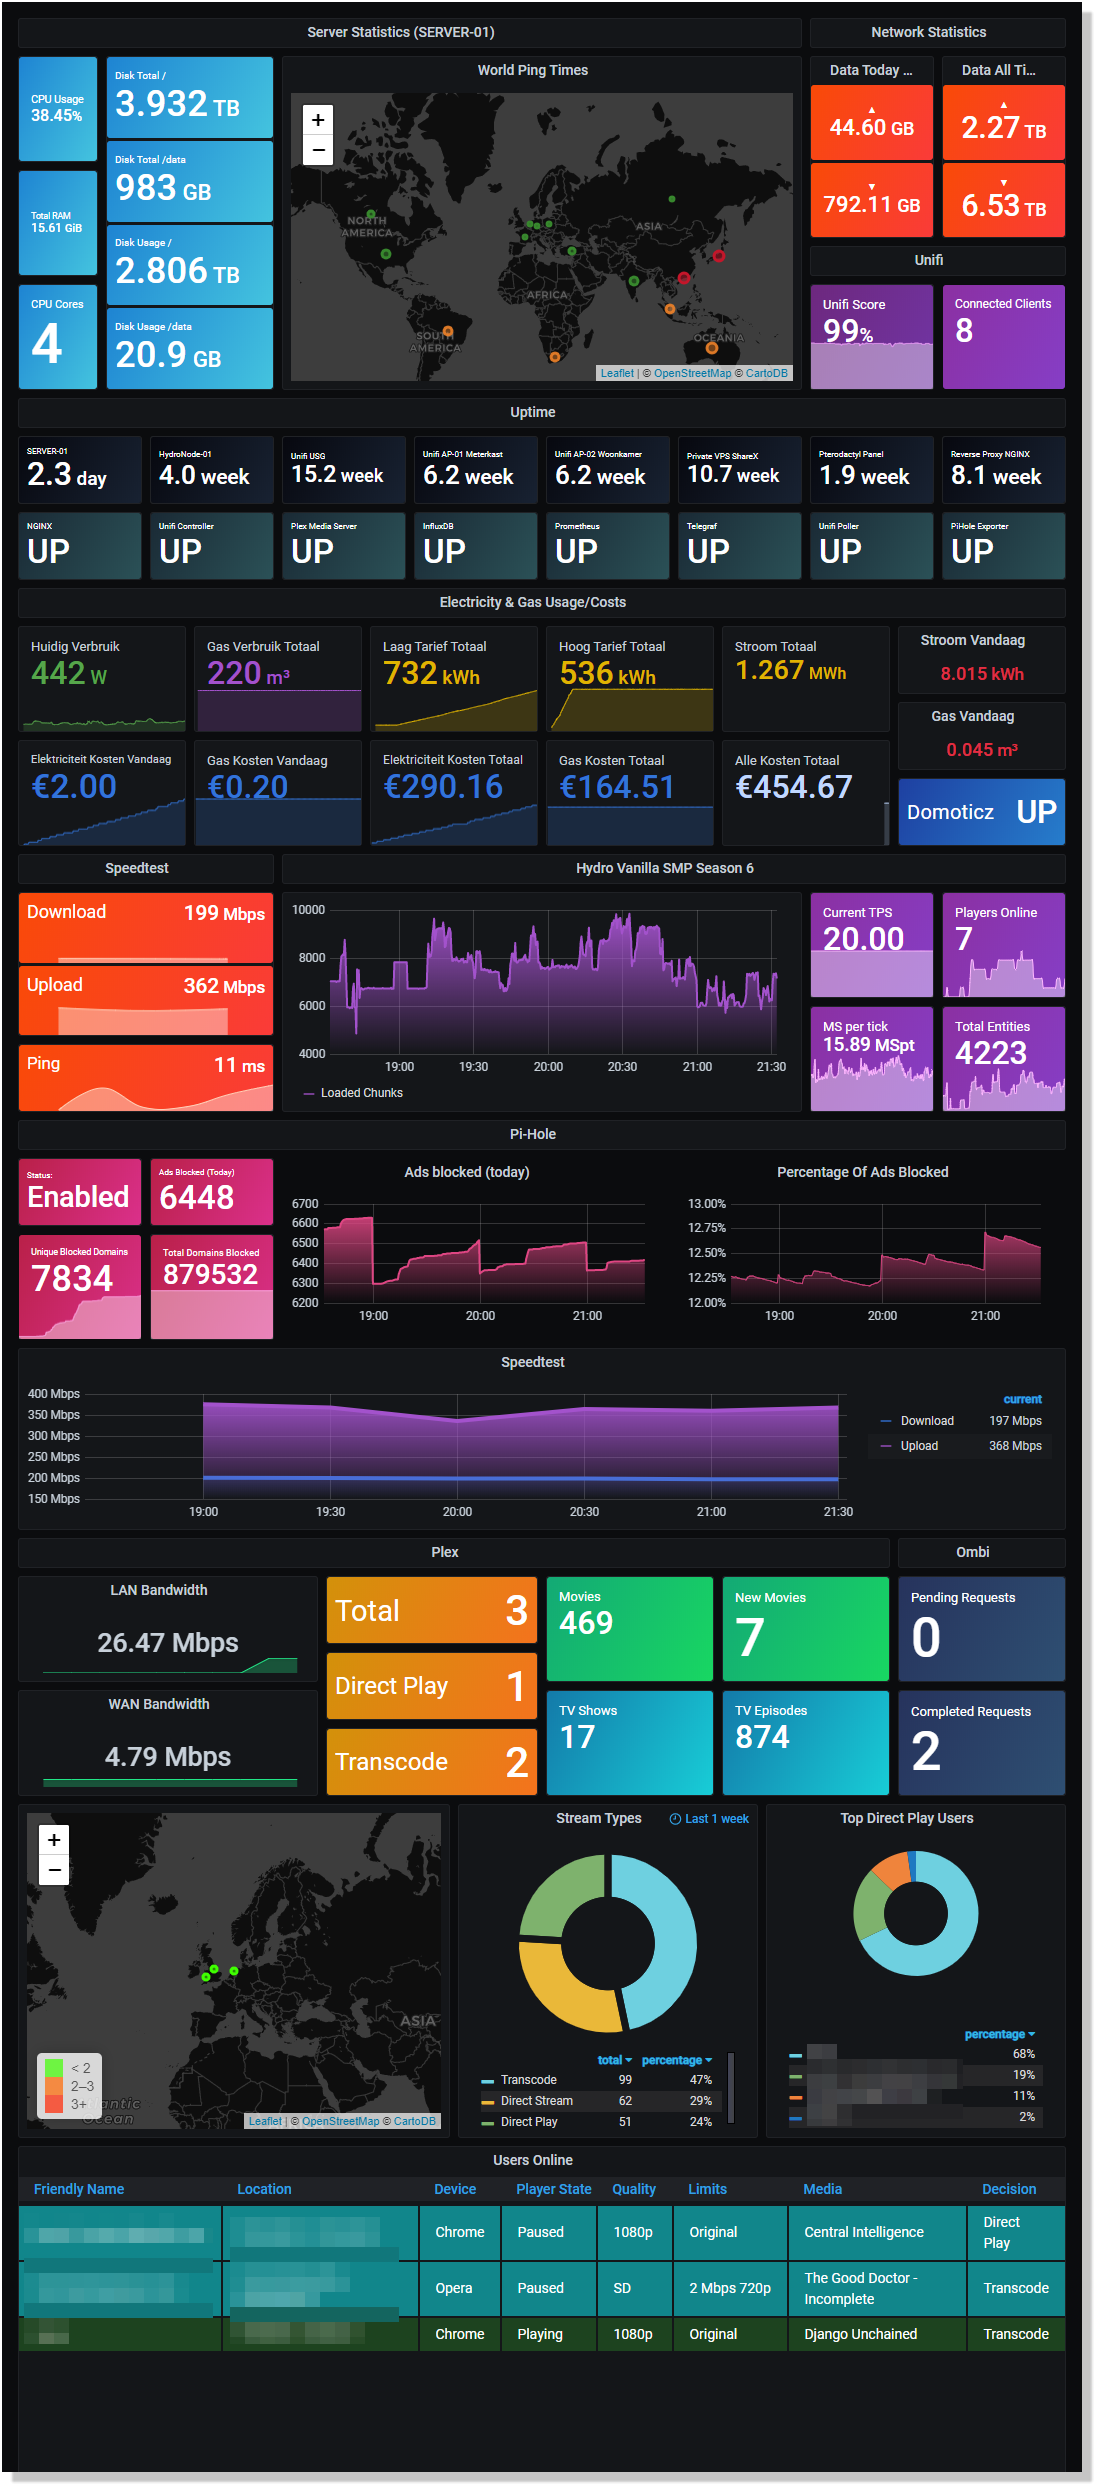
Even though my Grafana Dashboard itself looks pretty and all, my entire setup is a complete mess to be fair. This is my first time ever really screwing around with Grafana and just seeing what I could do with it. Most of this stuff is ran off of my old gaming rig that I installed with Debian and have running as a home server. Next to that I have a few PI's for stuff like Domoticz, and Pi-Hole.
Before I started on this I had no knowledge of antything like Docker of Proxmox, so all of this stuff is just ran on a single box, without any shielding, containerizing or virtualisation. I know that's probably a blasphemy, but I already have plans for a new home server on which I this time will use something like Docker or Proxmox.
| #!/bin/bash | |
| # Filename: grab-magnets-from-watchdir.custom-cont-init-script | |
| # Save this file in /config/custom-cont-init.d/ | |
| # This way it will run everytime the container is created and will add the crontab entry and transmission authentication | |
| # Save env files to get authentication | |
| printenv | sed 's/^\(.*\)$/export \1/g' > /root/container.env | |
| # Add entry to crontab, runs every minute | |
| echo '* * * * * . /root/container.env; /config/grab-magnets-from-watchdir.sh' >> /etc/crontabs/root |