The FBI Unified Crime Reporting folks have released a treaure trove of data but stuck it behind either an API or a ReactJS interactive bulk download selection process. The links here were generated from the obfuscated js data elements. This shld make it easier for folks to download the entire data set in bulk.
boB Rudis hrbrmstr
💤
cpsievert
/ europe.R
Last active
December 1, 2017 23:05
— forked from halhen/europe.R
This file contains hidden or bidirectional Unicode text that may be interpreted or compiled differently than what appears below. To review, open the file in an editor that reveals hidden Unicode characters.
Learn more about bidirectional Unicode characters
| library(tidyverse) | |
| library(plotly) | |
| # I'm being lazy, please don't do this | |
| # setwd("~/Downloads/Version 2_0_1/") | |
| d <- read_csv('GEOSTAT_grid_POP_1K_2011_V2_0_1.csv') %>% | |
| rbind(read_csv('JRC-GHSL_AIT-grid-POP_1K_2011.csv') %>% | |
| mutate(TOT_P_CON_DT = '')) %>% | |
| mutate( |

This file contains hidden or bidirectional Unicode text that may be interpreted or compiled differently than what appears below. To review, open the file in an editor that reveals hidden Unicode characters.
Learn more about bidirectional Unicode characters
| # | |
| # This Shiny web application demonstrates the use of custom image files | |
| # in place of icons for value boxes in Shiny Dashboard by overriding two | |
| # functions: | |
| # | |
| # 'icon' from the shiny package and 'valueBox' from the shinydashboard package. | |
| # | |
| # Each function adds minimal, specific additional handling of image files. | |
| # Note: A custom css file must also be included so that value boxes can | |
| # display the icons. For that reason, do not expect images in place of icons to |
djspiewak
/ getting-started-in-scala.md
Last active
November 15, 2024 14:38
This is my attempt to give Scala newcomers a quick-and-easy rundown to the prerequisite steps they need to a) try Scala, and b) get a standard project up and running on their machine. I'm not going to talk about the language at all; there are plenty of better resources a google search away. This is just focused on the prerequisite tooling and machine setup. I will not be assuming you have any background in JVM languages. So if you're coming from Python, Ruby, JavaScript, Haskell, or anywhere… I hope to present the information you need without assuming anything.
Disclaimer It has been over a decade since I was new to Scala, and when I was new to Scala, I was coming from a Java and Ruby background. This has probably caused me to unknowingly make some assumptions. Please feel free to call me out in comments/tweets!
One assumption I'm knowingly making is that you're on a Unix-like platform. Sorry, Windows users.
patperu
/ get_measures.R
Last active
February 11, 2016 16:29
Markers and request from - http://anasim.iet.unipi.it/moniqa/#home
This file contains hidden or bidirectional Unicode text that may be interpreted or compiled differently than what appears below. To review, open the file in an editor that reveals hidden Unicode characters.
Learn more about bidirectional Unicode characters
| library('httr') | |
| library('jsonlite') | |
| get_measures <- function(deviceid) { | |
| .h <- list( | |
| "Origin" = "http://anasim.iet.unipi.it", | |
| "Accept-Encoding" = "gzip, deflate", | |
| "Accept-Language" = "it-IT,it;q=0.8,en-US;q=0.6,en;q=0.4", | |
| "User-Agent" = "Mozilla/5.0 (Windows NT 6.3; WOW64) AppleWebKit/537.36 (KHTML, like Gecko) Chrome/48.0.2564.103 Safari/537.36", |
hrbrmstr
/ ahealth.md
Last active
June 30, 2019 12:09
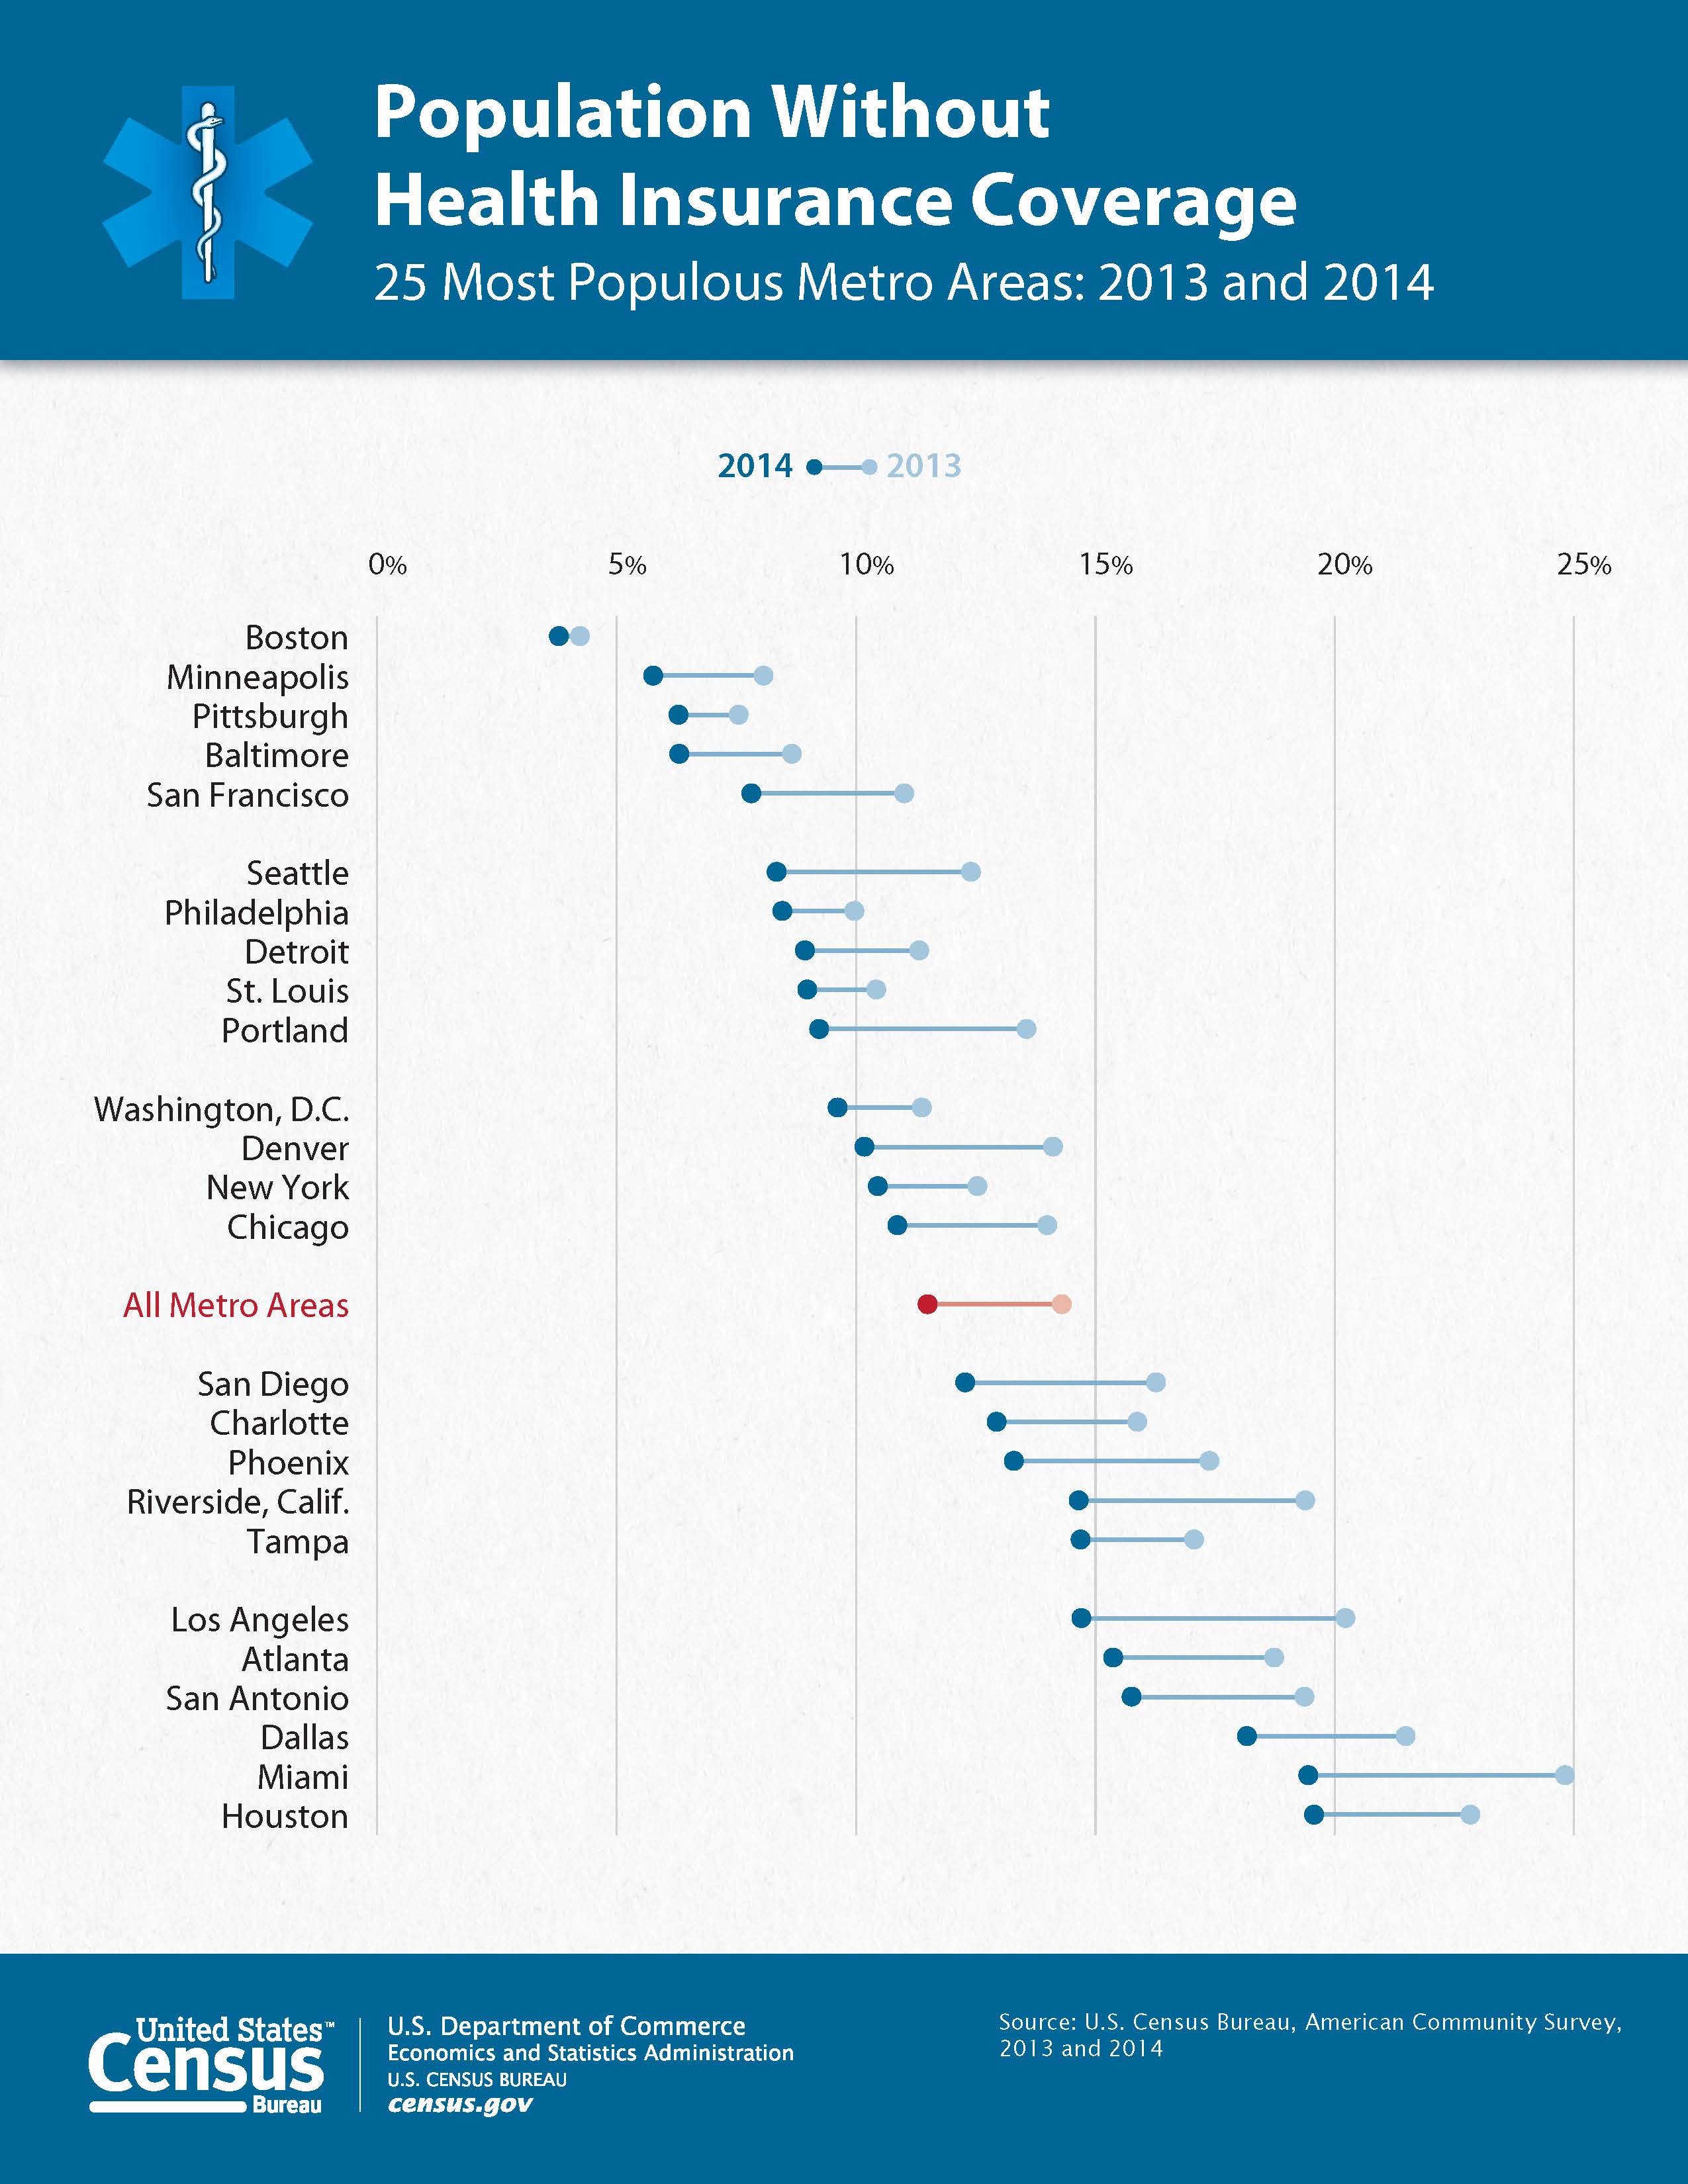
R+ggplot2 version of the "dumbbell" plot at http://census.gov/content/dam/Census/newsroom/releases/2015/cb15-158_graphic_acs_metro.jpg
This hit #rstats today:
Has anyone made a dumbbell dot plot in #rstats, or better yet exported to @plotlygraphs using the API? https://t.co/rWUSpH1rRl
— Ken Davis (@ken_mke) October 23, 2015So, I figured it was worth a cpl mins to reproduce.
While the US gov did give the data behind the chart it was all the data and a pain to work with so I used WebPlotDigitizer to transcribe the points and then some data wrangling in R to clean it up and make it work well with ggplot2.
It is possible to make the top "dumbbell" legend in ggplot2 (but not by using a guide) and color the "All Metro A
about:config settings to harden the Firefox browser. Privacy and performance enhancements.
To change these settings type 'about:config' in the url bar.
Then search the setting you would like to change and modify the value. Some settings may break certain websites from functioning and
rendering normally. Some settings may also make firefox unstable.
I am not liable for any damages/loss of data.
Not all these changes are necessary and will be dependent upon your usage and hardware. Do some research on settings if you don't understand what they do. These settings are best combined with your standard privacy extensions
(HTTPS Everywhere No longer required: Enable HTTPS-Only Mode, NoScript/Request Policy, uBlock origin, agent spoofing, Privacy Badger etc), and all plugins set to "Ask To Activate".
DonnchaC
/ onion-address-calculate.py
Created
August 25, 2015 14:24
Simple script to calculate the onion address from a Tor hidden service descriptor or public key
This file contains hidden or bidirectional Unicode text that may be interpreted or compiled differently than what appears below. To review, open the file in an editor that reveals hidden Unicode characters.
Learn more about bidirectional Unicode characters
| import hashlib | |
| import base64 | |
| import argparse | |
| import sys | |
| from Crypto.PublicKey import RSA | |
| def calculate_onion(pem_key): | |
| key = RSA.importKey(pem_key) |