# A huge plot (scatter plot matrix)
One disadvantage of `recordPlot()` is that it may not be able to record huge plots due to memory limits, e.g. a scatter plot matrix of tens of thousands of points:
```r
# generate some random data
dat = matrix(runif(1e+05), ncol = 5)
dat[, 3] = -0.2 * dat[, 1] + 0.8 * dat[, 2] # to make the plot less boring
```
```r
pairs(dat)
```
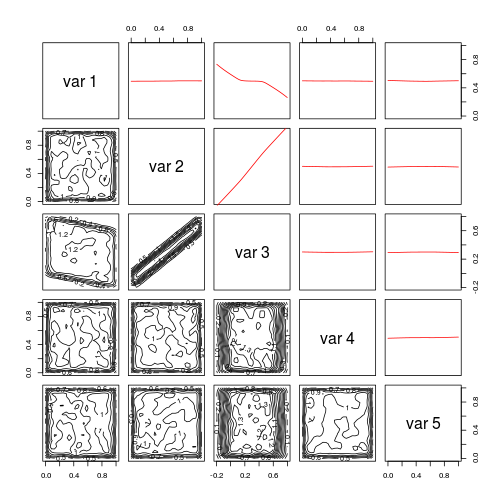
But scatter plots with such a large number of points are usually difficult to read (basically you can see nothing), so we'd better use some alternative ways to visualize them. For example, we can use 2D density estimates and draw contour plots, or just plot the LOWESS curve.
```r
dens2d = function(x, y, ...) {
library(MASS)
res = kde2d(x, y)
with(res, contour(x, y, z, add = TRUE))
}
pairs(dat, lower.panel = dens2d, upper.panel = function(x, y, ...) {
lines(lowess(y ~ x), col = "red")
})
```