Suppose we want to interpolate a number of points along each line in a layer:
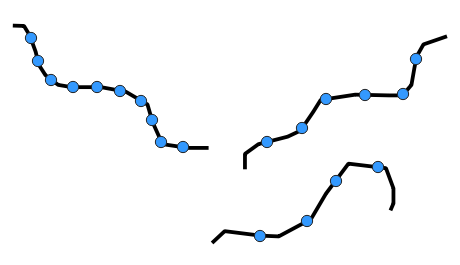
We have a column called stations that specifies how many points to
interpolate on each line:

UPDATE: As of October 2019, QGIS 3.10 has built-in support for label callout lines!
Callouts, sometimes called leader lines, are lines between labels and features on a map. They are useful when constraints of space force a label to be moved away from the
DCAT is pretty complex, and I'm wondering if it perhaps is overkill for GeoBlacklight records. If we aren't planning to use the full DCAT standard (and, no, I'm not suggesting that we do), is it really that helpful to use just the DCAT distribution?
The following is an attempt to present metadata, webservices, and downloads as simply as possible, with a top-level property for each of those groupings. These groupings will make it easier to automatically render a list of metadata options, or download options, or webservices options, on the GeoBlacklight page.
Each grouping contains an array of objects which typically have just a type and a url. I've tried to keep the type values as simple as possible. The type value could be used as button or link labels in GeoBlacklight, but this could be overridden by the optional label value, which would be especially useful to distinguish multiple entries of the having the same basic `t
Realistically, especially when considering the inherent noise in the original image, I'd settle for lossy compression with COMPRESS=JPEG JPEG_QUALITY=90, which could reduce file size fairly quickly to 16% of the original.
But if lossless compression is a hard requirement, I'd probably go with COMPRESS=LZW PREDICTOR=2. However, I would want to verify that any downstream tools would support this sort of compression.
UPDATE: When saving with JPEG compression, further speed and size improvements are gained by adding PHOTOMETRIC=YCBCR, which uses a different color space that has even better compression. I've added new rows to the table for YCBCR, as well as .jp2 formats.
The NYS GIS Program Office geocoding service can geocode structured addresses (with street number, city, zipcode, etc. in different fields) as well as freeform addresses (with everything in a single field).
This geocoder is available as an ArcGIS REST GeocodeServer, which is great if you are using Esri software, but what if you are not? Below, we'll see how to use the geocoder within Google Sheets, for an easy way to geocode addresses across New York State, without having to use any special software.
Calls to an ArcGIS GeocodeServer can be written in the form of a URL with parameters for the input address and output settings. Here is an example, broken into separate lines for readability:
Let's suppose we have a dataset of research studies conducted in various countries, and some studies are associated with multiple countries. Our studies table might have multiple comma-delimited values in the country column, and there might be spaces after some of those commas, looking something like this:
| id | title | country |
|---|---|---|
| 1 | Study one | Mauritania |
| 2 | Study two | Mali |
| 3 | Study three | Guinea |
| 4 | Study four | Mali,Guinea |
Download the GeoCorr2014 table via http://mcdc.missouri.edu/applications/geocorr2014.html
NOTE: Unfortunately, the output doesn't include the full tract FIPS codes, so we'll need to deal with that. Here are some rows showing the geocorr columns we'll be using:
flowmap.blue offers a relatively easy way to create flow maps in a web browser. It's also possible to create the maps from data in a google sheet. https://flowmap.blue/in-browser
Tom Chadwin describes how he created pseudo-3d arched flow lines using QGIS https://medium.com/@tomchadwin/mapping-emotion-fighting-school-closures-with-qgis-28842661bf14
"Design principles for origin-destination flow maps", an article by Bernhard Jenny, et al. discusses all the things you'll want to think about for the cartography of a flow map.
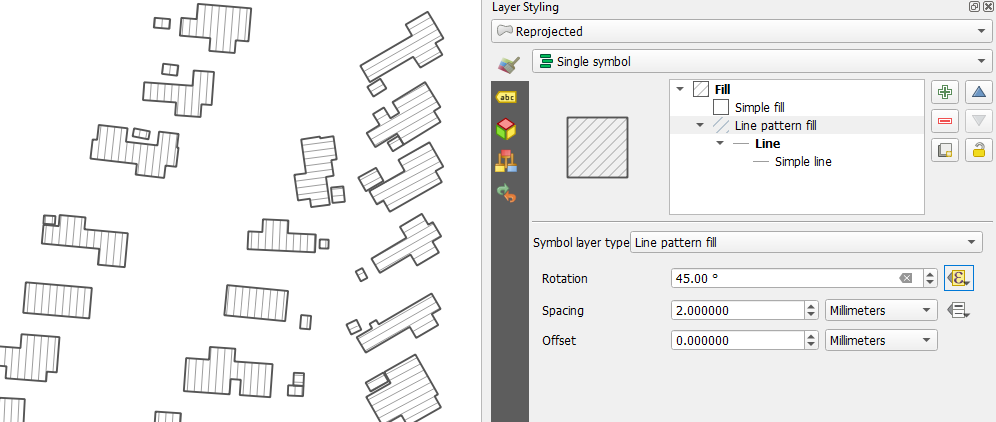
Use the following expression for the rotation value:
90 - azimuth(
  point_n( $geometry, 1),
  point_n( $geometry, 2)
) / 3.1415927 * 180