Skip to content

Instantly share code, notes, and snippets.

View kgjenkins's full-sized avatar

Keith Jenkins kgjenkins

View GitHub Profile
<!DOCTYPE html>
<html>
<head>
<meta charset=utf-8 />
<title>Demo</title>
<meta name='viewport' content='width=device-width, initial-scale=1.0, maximum-scale=1.0, user-scalable=no' />
<link rel="stylesheet" href="https://unpkg.com/[email protected]/dist/leaflet.css"
GEOID10 GEOID10_2
0102200 0102200
0101700 0102200
0102300 0102200
0102600 0102200
0102703 0102200
0102100 0102200
1203301 0102200
1211300 0102200
1209100 0102200
@kgjenkins
kgjenkins / README.md
Last active February 20, 2020 21:06
Paint splotch icons in QGIS

Paint splatter icons in QGIS

QGIS has the ability to style points using SVG symbols, and size and color them by attributes of the points.

SVG is a file format that means Scalable Vector Graphics. Because they are a vector format, they can easily be sized without losing detail or becoming pixelated (as can happen with raster icons).

Free or public domain SVG files can be found on the web. For example, here is a collection of paint splatters: https://svgsilh.com/tag/splatter-1.html

SVG files are actually text files that can be viewed in any text editor. Many SVGs are solid black; if you want to be able to color them in QGIS you'll want to edit the SVG and change fill="#000000" to fill="param(fill)" -- this has already been done for splatter1.svg -- click the "raw" button below to see the SVG code.
@kgjenkins
kgjenkins / README.md
Last active February 20, 2020 17:30
Splitting MS Buildings into county-based files

Splitting Microsoft Buildings into county-based files

Microsoft US Building Footprints are available at:
https://github.com/Microsoft/USBuildingFootprints

The state-based downloads are in .geojson format, which is a pretty bad choice for datasets this large. Bad because .geojson has no spatial index, making it very slow to load and render. So it will be useful to split and save them into a separate file (geopackage or shapefile) for each county. Also, some of the polygons have invalid geometries that we should fix along the way.

@kgjenkins
kgjenkins / readme.md
Last active February 13, 2020 18:03
QGIS actions for loading raster tiles from an index map
from qgis.utils import iface
active_layer = iface.activeLayer()

tile = QgsRasterLayer('[%downloadUrl%]')
QgsProject.instance().addMapLayer(tile)
r = QgsHillshadeRenderer(tile.dataProvider(), 1, 315, 45)
tile.setRenderer(r)

iface.setActiveLayer(active_layer)
@kgjenkins
kgjenkins / readme.md
Last active June 9, 2022 10:13
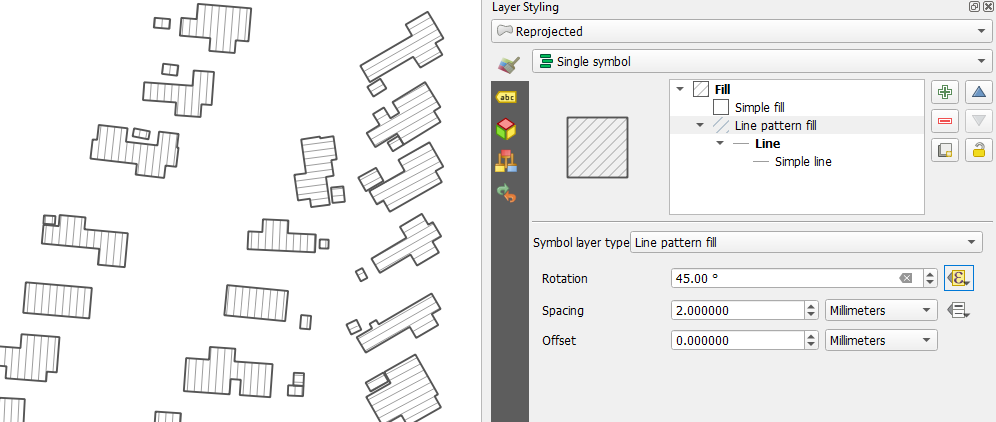
QGIS line fill based on polygon angle

image

Use the following expression for the rotation value:

90 - azimuth(
  point_n( $geometry, 1),
  point_n( $geometry, 2)
) / 3.1415927 * 180
@kgjenkins
kgjenkins / readme.md
Created November 18, 2019 22:36
Flow mapping

Resources for flow mapping

flowmap.blue offers a relatively easy way to create flow maps in a web browser. It's also possible to create the maps from data in a google sheet. https://flowmap.blue/in-browser

Tom Chadwin describes how he created pseudo-3d arched flow lines using QGIS https://medium.com/@tomchadwin/mapping-emotion-fighting-school-closures-with-qgis-28842661bf14

"Design principles for origin-destination flow maps", an article by Bernhard Jenny, et al. discusses all the things you'll want to think about for the cartography of a flow map.

@kgjenkins
kgjenkins / readme.md
Last active October 29, 2019 19:36
GeoCorr example

geocorr2014

Download the GeoCorr2014 table via http://mcdc.missouri.edu/applications/geocorr2014.html

  • Select a state.
  • Select the "source" and "target" geographies. (For example, if you have demographic data at the tract level, and want to map it to Voting Tabulation Districts (VTD), set VTD as the source and tract as the target. (Yes, this seems counterintuitive.)
  • Weight by population (2010 census)
  • Generate CSV file. (The report is unnecessary.)

NOTE: Unfortunately, the output doesn't include the full tract FIPS codes, so we'll need to deal with that. Here are some rows showing the geocorr columns we'll be using:

@kgjenkins
kgjenkins / readme.md
Last active July 23, 2019 21:41
Aggregate counts of multi-valued columns

Aggregate counts of multi-valued columns

Let's suppose we have a dataset of research studies conducted in various countries, and some studies are associated with multiple countries. Our studies table might have multiple comma-delimited values in the country column, and there might be spaces after some of those commas, looking something like this:

id title country
1 Study one Mauritania
2 Study two Mali
3 Study three Guinea
4 Study four Mali,Guinea
@kgjenkins
kgjenkins / readme.md
Last active May 3, 2024 12:21
Creating halftones in QGIS

Creating halftones in QGIS

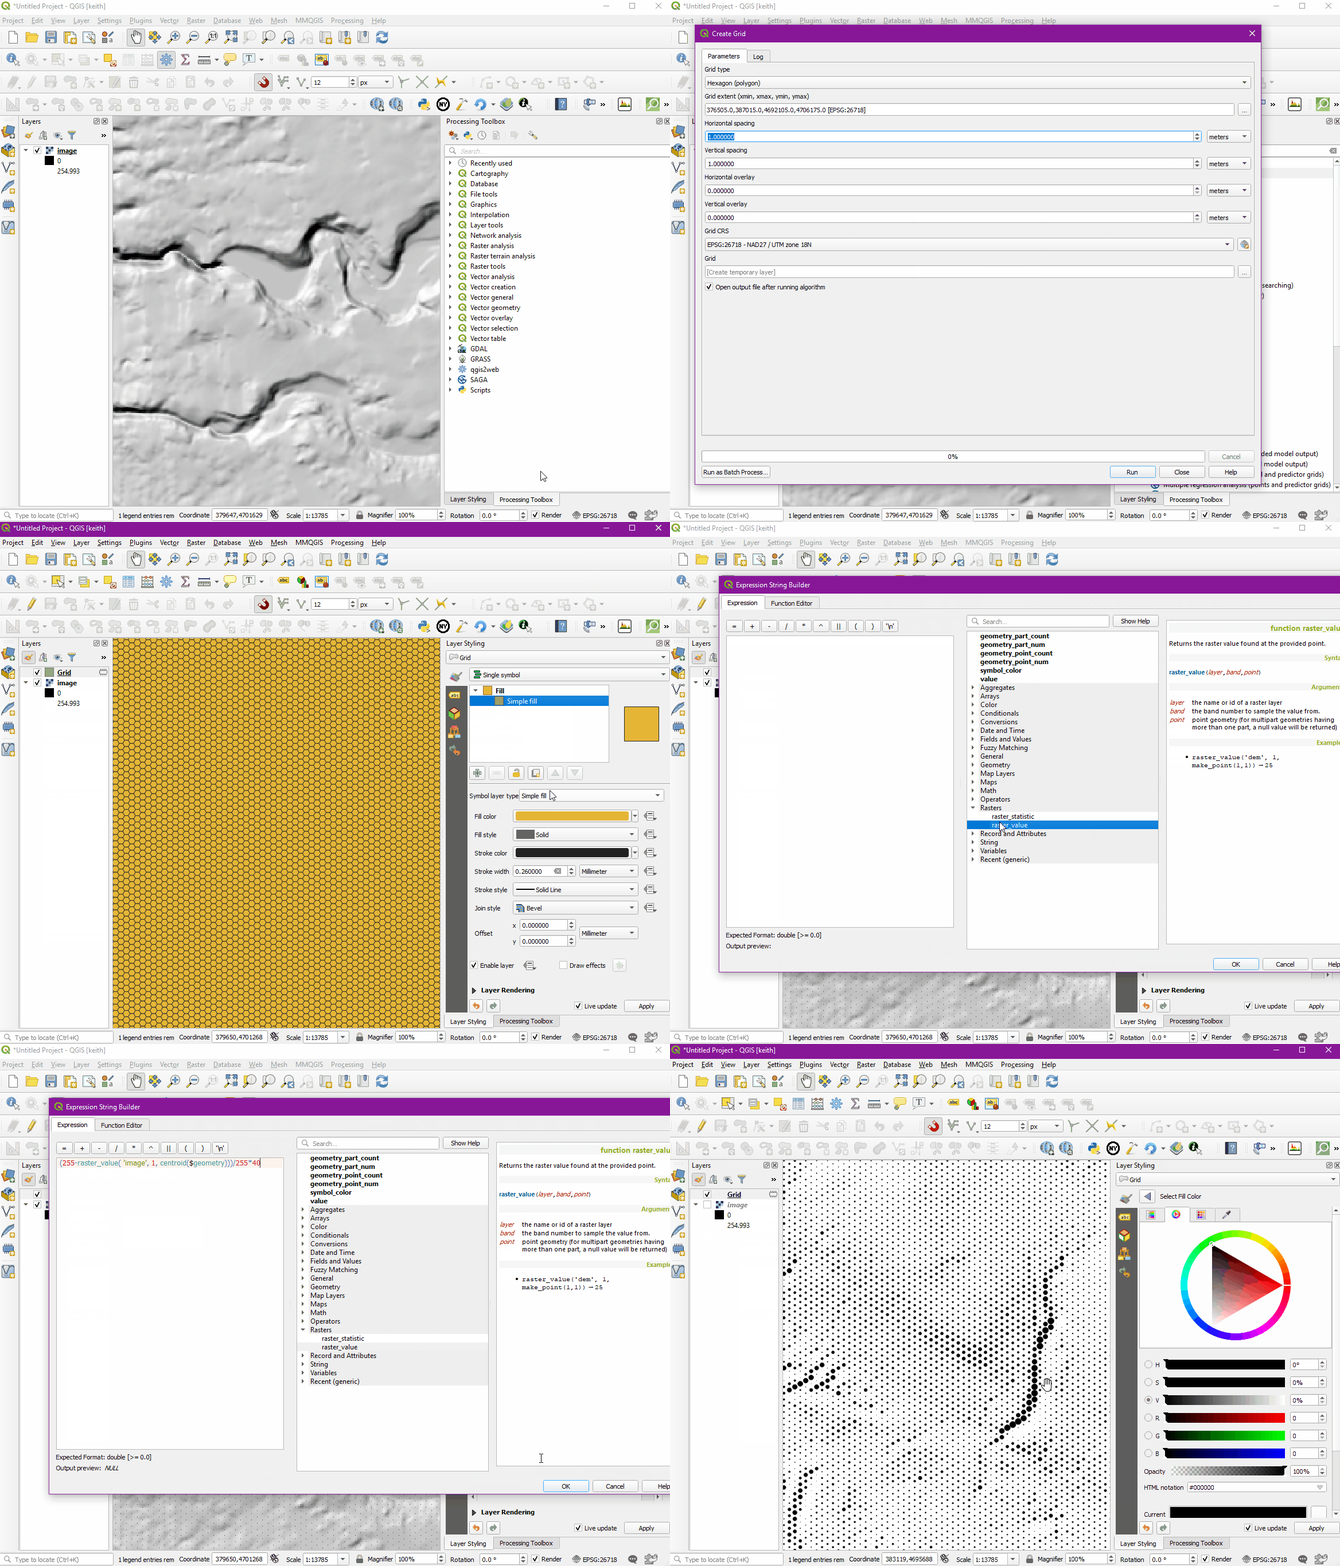
A quick demo using a hexagon grid with a centroid fill of points sized using raster values from the image layer.

qgis-hex-halftones2