As defined by Mike Bostock here - last updated 4/12/2019
- Define the
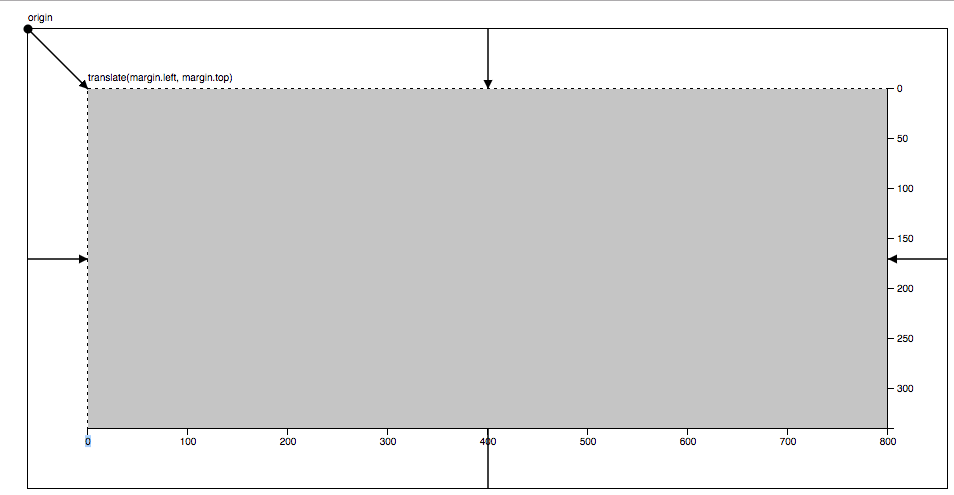
marginobject with properties for the four sides (clockwise from top, as in CSS)
var margin = {top: 20, right: 10, bottom: 20, left: 10};- Define
widthandheightas the inner dimensions of the chart area
var width = 960 - margin.left - margin.right;
var height = 500 - margin.top - margin.bottom;- Define
svgas aGelement that translates to the origin to the top-left corner of the chart area
var svg = d3.select("body").append("svg")
  .attr("width", width + margin.left + margin.right)
  .attr("height", height + margin.top + margin.bottom)
  .append("g")
  .attr("transform", `"translate(${margin.left}, ${margin.top})"`)
With this convention, all subsequent code can ignore margins.
var x = d3.scaleLinear().range([0, width]);
var y = d3.scaleLinear().range([height, 0]);
If you want to add axes to the chart, they will be positioned correctly by default in the "left" and "top" orientations. For "right" or "bottom" orientation, translate the axis G element by the width or height, respectively.