Created
May 18, 2020 00:22
-
-
Save BaksiLi/d675b683ebaf9fe24a99447f7e1a32c0 to your computer and use it in GitHub Desktop.
Visualize WakaTime statistics data in a decent way
This file contains hidden or bidirectional Unicode text that may be interpreted or compiled differently than what appears below. To review, open the file in an editor that reveals hidden Unicode characters.
Learn more about bidirectional Unicode characters
| #!/usr/bin/env python | |
| # -*- coding: utf-8 -*- | |
| import json | |
| from argparse import ArgumentDefaultsHelpFormatter, ArgumentParser | |
| from time import localtime | |
| import plotly.graph_objects as go | |
| def read_from(fpath): | |
| with open(fpath, 'r') as f: | |
| text = f.read() | |
| return json.loads(text) | |
| def get_entry(days_obj, option) -> dict: | |
| valid_options = ['editors', 'languages'] | |
| if option in valid_options: | |
| entry_name = option | |
| else: | |
| print(f'Option {option} not valid, using editors...') | |
| entry_name = 'editors' | |
| entry_by_day = [ | |
| single_entry for i in days_obj for single_entry in i[entry_name] | |
| ] | |
| entry_dict = {} | |
| for single in entry_by_day: | |
| single_name = single['name'] | |
| time_used = single['total_seconds'] | |
| if single_name in entry_dict: | |
| entry_dict[single_name] += time_used | |
| else: | |
| entry_dict[single_name] = time_used | |
| return entry_dict | |
| def plot_pie(lv: dict): | |
| labels = list(lv.keys()) | |
| values = list(lv.values()) | |
| fig = go.Figure( | |
| data=[ | |
| go.Pie( | |
| labels=labels, | |
| values=values, | |
| textinfo='label+percent' | |
| # insidetextorientation='radial' | |
| ) | |
| ] | |
| ) | |
| fig.show() | |
| def parsed(): | |
| parser = ArgumentParser( | |
| description='Visualize WakaTime data in a decent way.', | |
| formatter_class=ArgumentDefaultsHelpFormatter | |
| ) | |
| parser.add_argument( | |
| 'file', | |
| help='Data file (.json) downloaded from \ | |
| https://wakatime.com/settings/account Export.' | |
| ) | |
| parser.add_argument( | |
| '--editor', '-e', action='store_true', help='Plot editor pie chart' | |
| ) | |
| parser.add_argument( | |
| '--language', | |
| '-l', | |
| action='store_true', | |
| help='Plot programming language pie chart' | |
| ) | |
| return parser | |
| if __name__ == '__main__': | |
| arguments = parsed().parse_args() | |
| json_f = read_from(arguments.file) | |
| print('Welcome {}!\n'.format(json_f['user']['display_name'])) | |
| get_y_m_d = lambda x: '-'.join([str(date) for date in localtime(x)[:3]]) | |
| time_started = get_y_m_d(json_f['range']['start']) | |
| time_ended = get_y_m_d(json_f['range']['end']) | |
| print(f'The file gives your data from {time_started} to {time_ended}.') | |
| days_obj = [i for i in json_f['days']] | |
| if arguments.editor: | |
| editors = get_entry(days_obj, 'editors') | |
| plot_pie(editors) | |
| if arguments.language: | |
| languages = get_entry(days_obj, 'languages') | |
| plot_pie(languages) | |
| else: | |
| print('Please provide some options.') |
Author
Sign up for free
to join this conversation on GitHub.
Already have an account?
Sign in to comment
Introduction
This is what I had for free from WakaTime.
Are you ENOUGH of the WakaTime default charts?
Usage
where
-eand-lare options, stand for Plot Editor and Plot Language.Requires Plotly, you can install it by
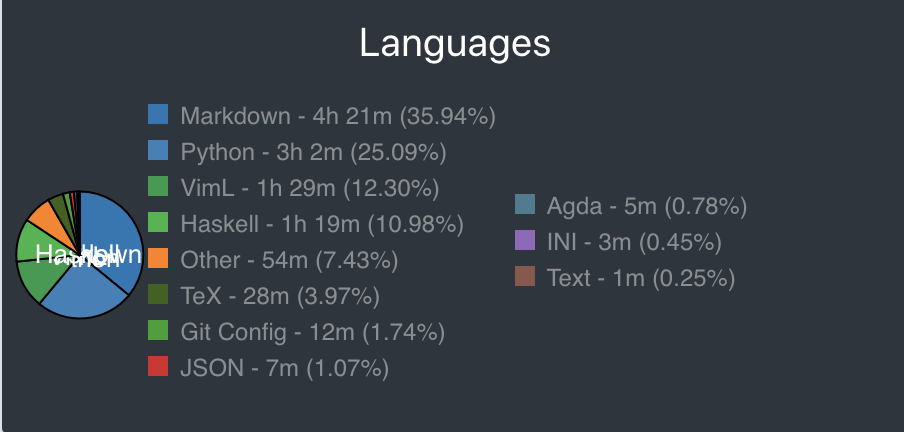
pip install plotly.Example
These Plots are interactive as they are on the WakaTime Dashboard.