Last active
January 14, 2020 22:26
-
-
Save CYHSM/fab32e2103c6df3909ad1a0d48174a64 to your computer and use it in GitHub Desktop.
This file contains hidden or bidirectional Unicode text that may be interpreted or compiled differently than what appears below. To review, open the file in an editor that reveals hidden Unicode characters.
Learn more about bidirectional Unicode characters
| """Creates a 3D surface plot, can be used as an example for demonstrating gradient descent | |
| Author: Markus Frey | |
| E-mail: [email protected] | |
| """ | |
| import numpy as np | |
| import pandas as pd | |
| import os | |
| import matplotlib.pyplot as plt | |
| from mpl_toolkits.mplot3d import axes3d | |
| import matplotlib.animation as animation | |
| from scipy.ndimage.filters import gaussian_filter | |
| plt.xkcd(); | |
| import seaborn as sns | |
| sns.set_style('white') | |
| # Set transparency off when exporting | |
| from matplotlib import patheffects, rcParams | |
| rcParams['path.effects'] = [patheffects.withStroke(linewidth=0)] | |
| # Get some mountain data ;) | |
| z_data = np.repeat(np.repeat(pd.read_csv('https://raw.githubusercontent.com/plotly/datasets/master/api_docs/mt_bruno_elevation.csv').values,2,axis=0),2,axis=1) | |
| # Create figure | |
| fig = plt.figure(figsize=(15,10)) | |
| ax = fig.add_subplot(111, projection="3d") | |
| # Create X,Y,Z | |
| X, Y = np.mgrid[-5:5:50j, -5:5:50j] | |
| Z = Y*np.sin(X) - X*np.cos(Y) * z_data | |
| Z = gaussian_filter(Z, 1) | |
| # Plot surface and contours | |
| ax.plot_surface(X, Y, Z, cmap="jet", lw=0.5, rstride=1, cstride=1) | |
| ax.contour(X, Y, Z, 10, cmap="jet", linestyles="solid", offset=-1) | |
| ax.contour(X, Y, Z, 10, colors="k", linestyles="solid") | |
| # Remove background | |
| ax.w_xaxis.set_pane_color((1.0, 1.0, 1.0, 1.0)) | |
| ax.w_yaxis.set_pane_color((1.0, 1.0, 1.0, 1.0)) | |
| ax.w_zaxis.set_pane_color((1.0, 1.0, 1.0, 1.0)) | |
| plt.tight_layout() | |
| def rotate(angle): | |
| ax.view_init(azim=angle) | |
| ani = animation.FuncAnimation(fig, rotate, frames=np.arange(0, 362, 2), interval=100) | |
| ani.save('3DRot.gif', dpi=80, writer='imagemagick') |
Author
Sign up for free
to join this conversation on GitHub.
Already have an account?
Sign in to comment
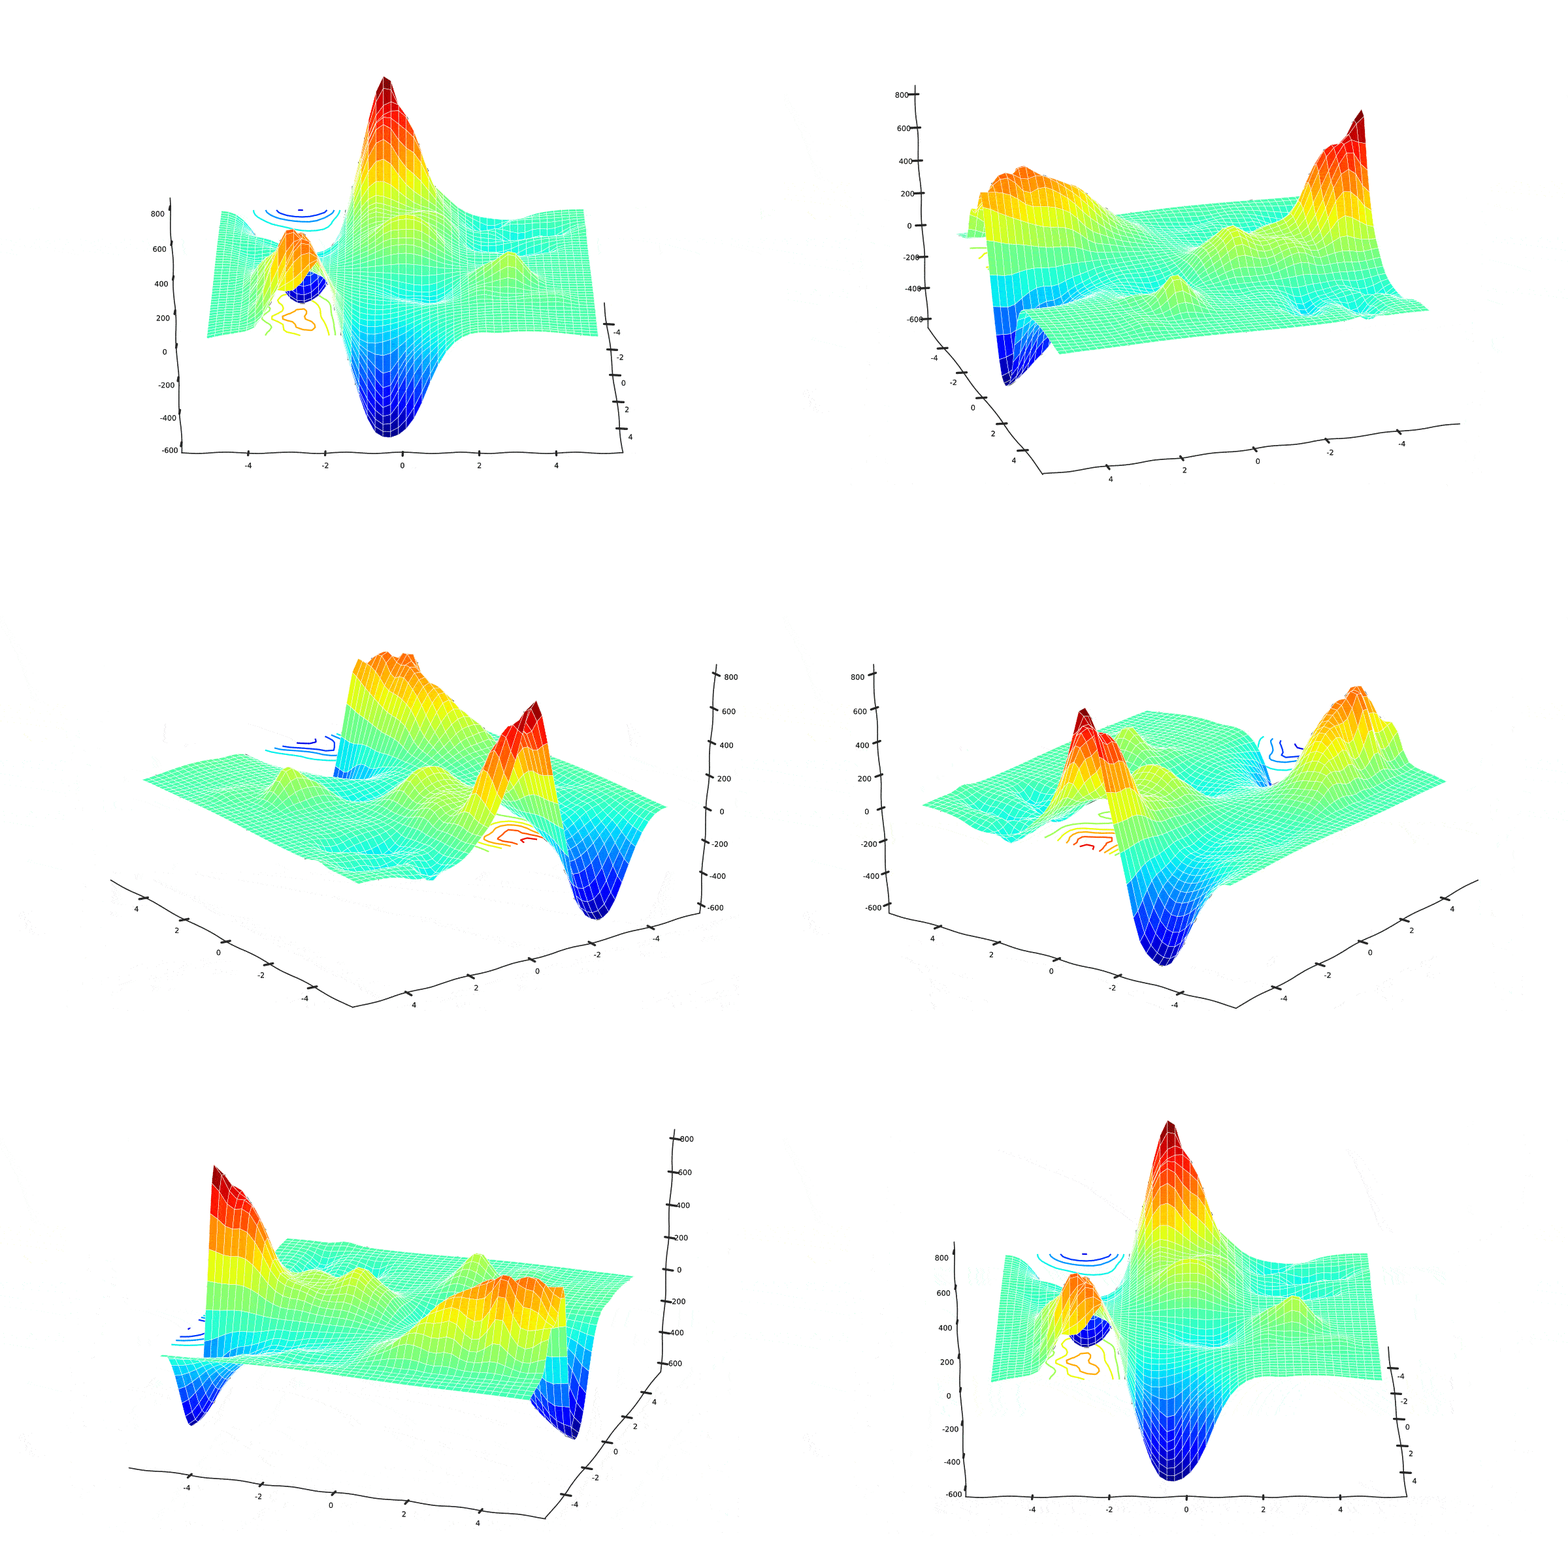
Output:
