Last active
March 25, 2022 17:17
-
-
Save ES-Alexander/e6755094b0c6191e68b312eb70ef79e6 to your computer and use it in GitHub Desktop.
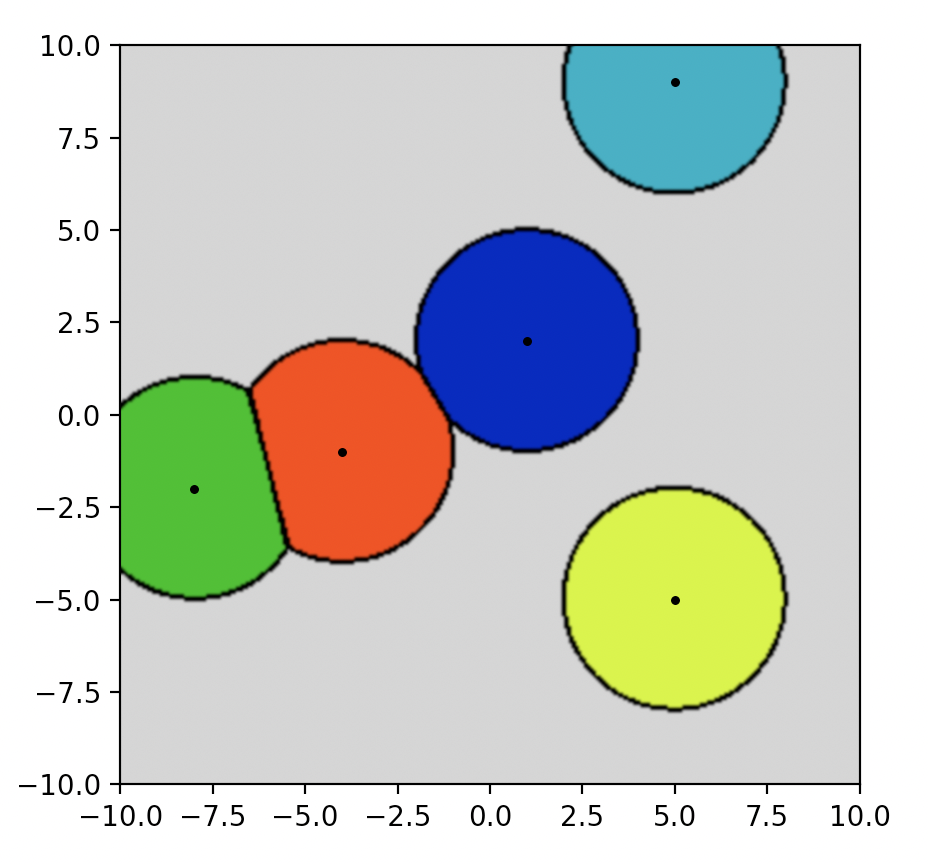
image-based radial voronoi diagram with rectangular bounds
This file contains hidden or bidirectional Unicode text that may be interpreted or compiled differently than what appears below. To review, open the file in an editor that reveals hidden Unicode characters.
Learn more about bidirectional Unicode characters
| from scipy.spatial import KDTree | |
| import matplotlib.pyplot as plt | |
| import numpy as np | |
| # SETUP | |
| points = np.array([[1,2],[5,9],[-8,-2],[5,-5],[-4,-1]]) | |
| xmin, xmax, ymin, ymax = -10, 10, -10, 10 | |
| x_resolution = y_resolution = 300 | |
| pixel_size = max((xmax-xmin)/x_resolution, (ymax-ymin)/y_resolution) | |
| radius = 3 | |
| # choose a colour map with decent spread, and dark+light ends | |
| cmap = 'nipy_spectral' # 'gist_ncar' | |
| # DATA WRANGLING | |
| x = np.linspace(xmin, xmax, x_resolution) | |
| y = np.linspace(ymin, ymax, y_resolution) | |
| X, Y = np.meshgrid(x, y) | |
| img_points = np.c_[X.ravel(), Y.ravel()] | |
| # create a KD Tree of the points of interest (for fast nearest-neighbours) | |
| tree = KDTree(points) | |
| # search for the two nearest neighbours within the radius | |
| # specifically 2 to see if a point is on an intersection line | |
| dists, indices = tree.query(img_points, k=2, | |
| distance_upper_bound=radius+pixel_size) | |
| # PLOTTING | |
| # closest point indices come first | |
| min_inds = indices[:,0] | |
| min_dists = dists[:,0] | |
| # non-matches are set to infinite distance | |
| min_inds[np.isinf(min_dists)] = len(points) # last colour | |
| # set borders to a consistent colour | |
| dist_diffs = np.abs(np.diff(dists, axis=1)).flatten() | |
| inner_borders = dist_diffs < 2 * pixel_size | |
| outer_borders = np.abs(min_dists - radius) < pixel_size | |
| min_inds[inner_borders | outer_borders] = -1 # first colour | |
| # plot the image at the desired location, with some smoothing | |
| plt.imshow(min_inds.reshape(y_resolution, -1), | |
| extent=(xmin,xmax,ymin,ymax), origin='lower', | |
| interpolation='bicubic', interpolation_stage='rgba', | |
| cmap=cmap) | |
| # plot the points | |
| plt.scatter(points[:,0], points[:,1], 5, 'k') | |
| plt.show() |
Author
Sign up for free
to join this conversation on GitHub.
Already have an account?
Sign in to comment
Made in response to this reddit post by
u/verticalfuzz.Example output: