Created
January 31, 2022 07:46
-
-
Save HajimeKawahara/5f25c7563883d25269513123aa7bc6d9 to your computer and use it in GitHub Desktop.
This file contains hidden or bidirectional Unicode text that may be interpreted or compiled differently than what appears below. To review, open the file in an editor that reveals hidden Unicode characters.
Learn more about bidirectional Unicode characters
| import GPy | |
| import numpy as np | |
| import matplotlib.pyplot as plt | |
| np.random.seed(seed=1) | |
| kernel = GPy.kern.Matern32(2, ARD=True) | |
| N = 100 | |
| X = np.random.uniform(-3.,3.,(N, 2)) | |
| Z = np.sin(X[:,0:1]) * np.sin(X[:,1:2]) + np.random.randn(N,1)*0.05 | |
| model = GPy.models.GPRegression(X, Z, kernel) | |
| model.optimize(messages=True, max_iters=1e5) | |
| ## prediction | |
| Nx=50 | |
| Ny=75 | |
| xgrid=np.linspace(-3, 3, Nx) | |
| ygrid=np.linspace(-3, 3, Ny) | |
| X1, X2 = np.meshgrid(xgrid,ygrid) | |
| input_grid = np.array([X1.flatten(), X2.flatten()]).T | |
| z_pred = model.predict_quantiles(input_grid, quantiles=(2.5, 50, 97.5))[1] | |
| from mpl_toolkits.mplot3d import Axes3D | |
| Zpred=z_pred.reshape(Ny,Nx) | |
| fig=plt.figure() | |
| ax = fig.add_subplot(111, projection='3d') | |
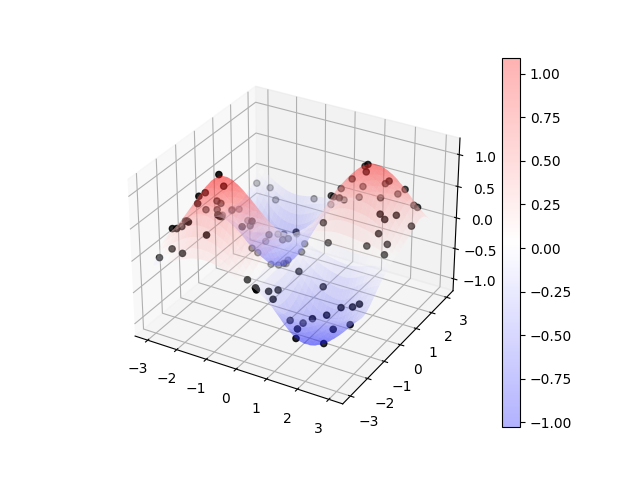
| surf = ax.plot_surface(X1, X2, Zpred, cmap='bwr', linewidth=0,alpha=0.3) | |
| ax.scatter3D(X[:,0],X[:,1],Z,color="k") | |
| fig.colorbar(surf) | |
| plt.show() |
Author
HajimeKawahara
commented
Jan 31, 2022
Sign up for free
to join this conversation on GitHub.
Already have an account?
Sign in to comment