Last active
March 16, 2020 02:34
-
-
Save KristianHolsheimer/2ea7850eddf90316d0fc0557ba9668c4 to your computer and use it in GitHub Desktop.
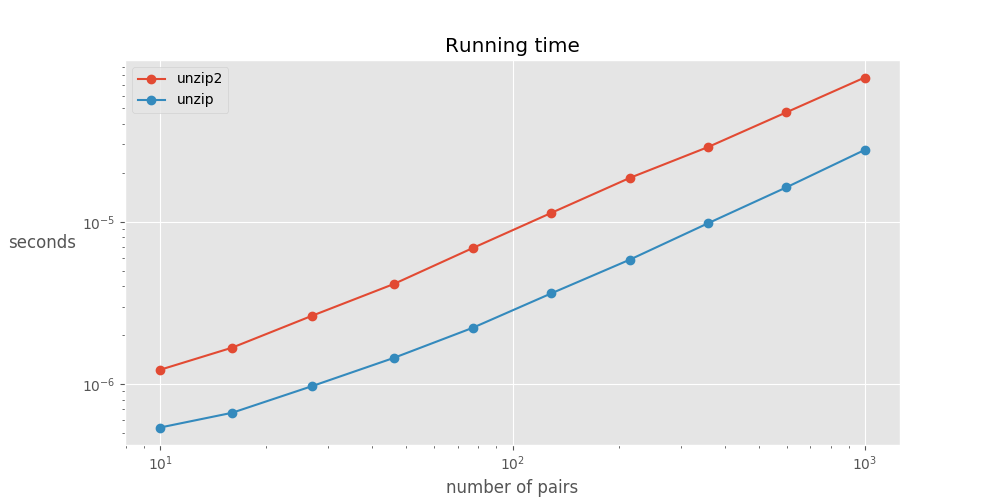
Code for generating plots running times for PR
This file contains hidden or bidirectional Unicode text that may be interpreted or compiled differently than what appears below. To review, open the file in an editor that reveals hidden Unicode characters.
Learn more about bidirectional Unicode characters
| from random import randint | |
| from timeit import timeit | |
| import pandas as pd | |
| import numpy as onp | |
| import matplotlib.pyplot as plt | |
| def unzip(tuples): | |
| return tuple(zip(*tuples)) | |
| def unzip2(xys): | |
| xs = [] | |
| ys = [] | |
| for x, y in xys: | |
| xs.append(x) | |
| ys.append(y) | |
| return tuple(xs), tuple(ys) | |
| def generate_items(n, k): | |
| # n = number of items, k = size of items | |
| return [tuple(randint(0, 9) for _ in range(k)) for _ in range(n)] | |
| # simple example, 3 pairs: | |
| generate_items(n=3, k=2) # --> [(9, 5), (2, 4), (0, 0)] | |
| # generate grid: | |
| results = [] | |
| for n in onp.logspace(1, 3, 10, dtype='int32'): | |
| items = generate_items(n=n, k=2) | |
| assert unzip2(items) == unzip(items) | |
| result_unzip2 = %timeit -q -o unzip2(items) | |
| result_unzip = %timeit -q -o unzip(items) | |
| results.append({ | |
| 'n': n, | |
| 'unzip2': result_unzip2.average, | |
| 'unzip2_lower': result_unzip2.average - 1.96 * result_unzip2.stdev, | |
| 'unzip2_upper': result_unzip2.average + 1.96 * result_unzip2.stdev, | |
| 'unzip': result_unzip.average, | |
| 'unzip_lower': result_unzip.average - 1.96 * result_unzip.stdev, | |
| 'unzip_upper': result_unzip.average + 1.96 * result_unzip.stdev, | |
| }) | |
| results = pd.DataFrame.from_records(results).set_index('n') | |
| # plot results | |
| ax = results.plot(y=['unzip2', 'unzip'], style='-o', logx=True, logy=True, figsize=(10, 5)) | |
| ax.fill_between(x=results.index, y1=results.unzip2_lower, y2=results.unzip2_upper, alpha=0.25) | |
| ax.fill_between(x=results.index, y1=results.unzip_lower, y2=results.unzip_upper, alpha=0.25) | |
| ax.set_ylabel('seconds', rotation=0, ha='right') | |
| ax.set_xlabel('number of pairs', rotation=0) | |
| ax.set_title('Running time') | |
| plt.savefig('running_times_plots.svg') | |
| plt.savefig('running_times_plots.png') |
Sign up for free
to join this conversation on GitHub.
Already have an account?
Sign in to comment
Output image: