Created
February 24, 2021 17:51
-
-
Save MaPePeR/f1a7db1a9ca10e8eee31636408f4971f to your computer and use it in GitHub Desktop.
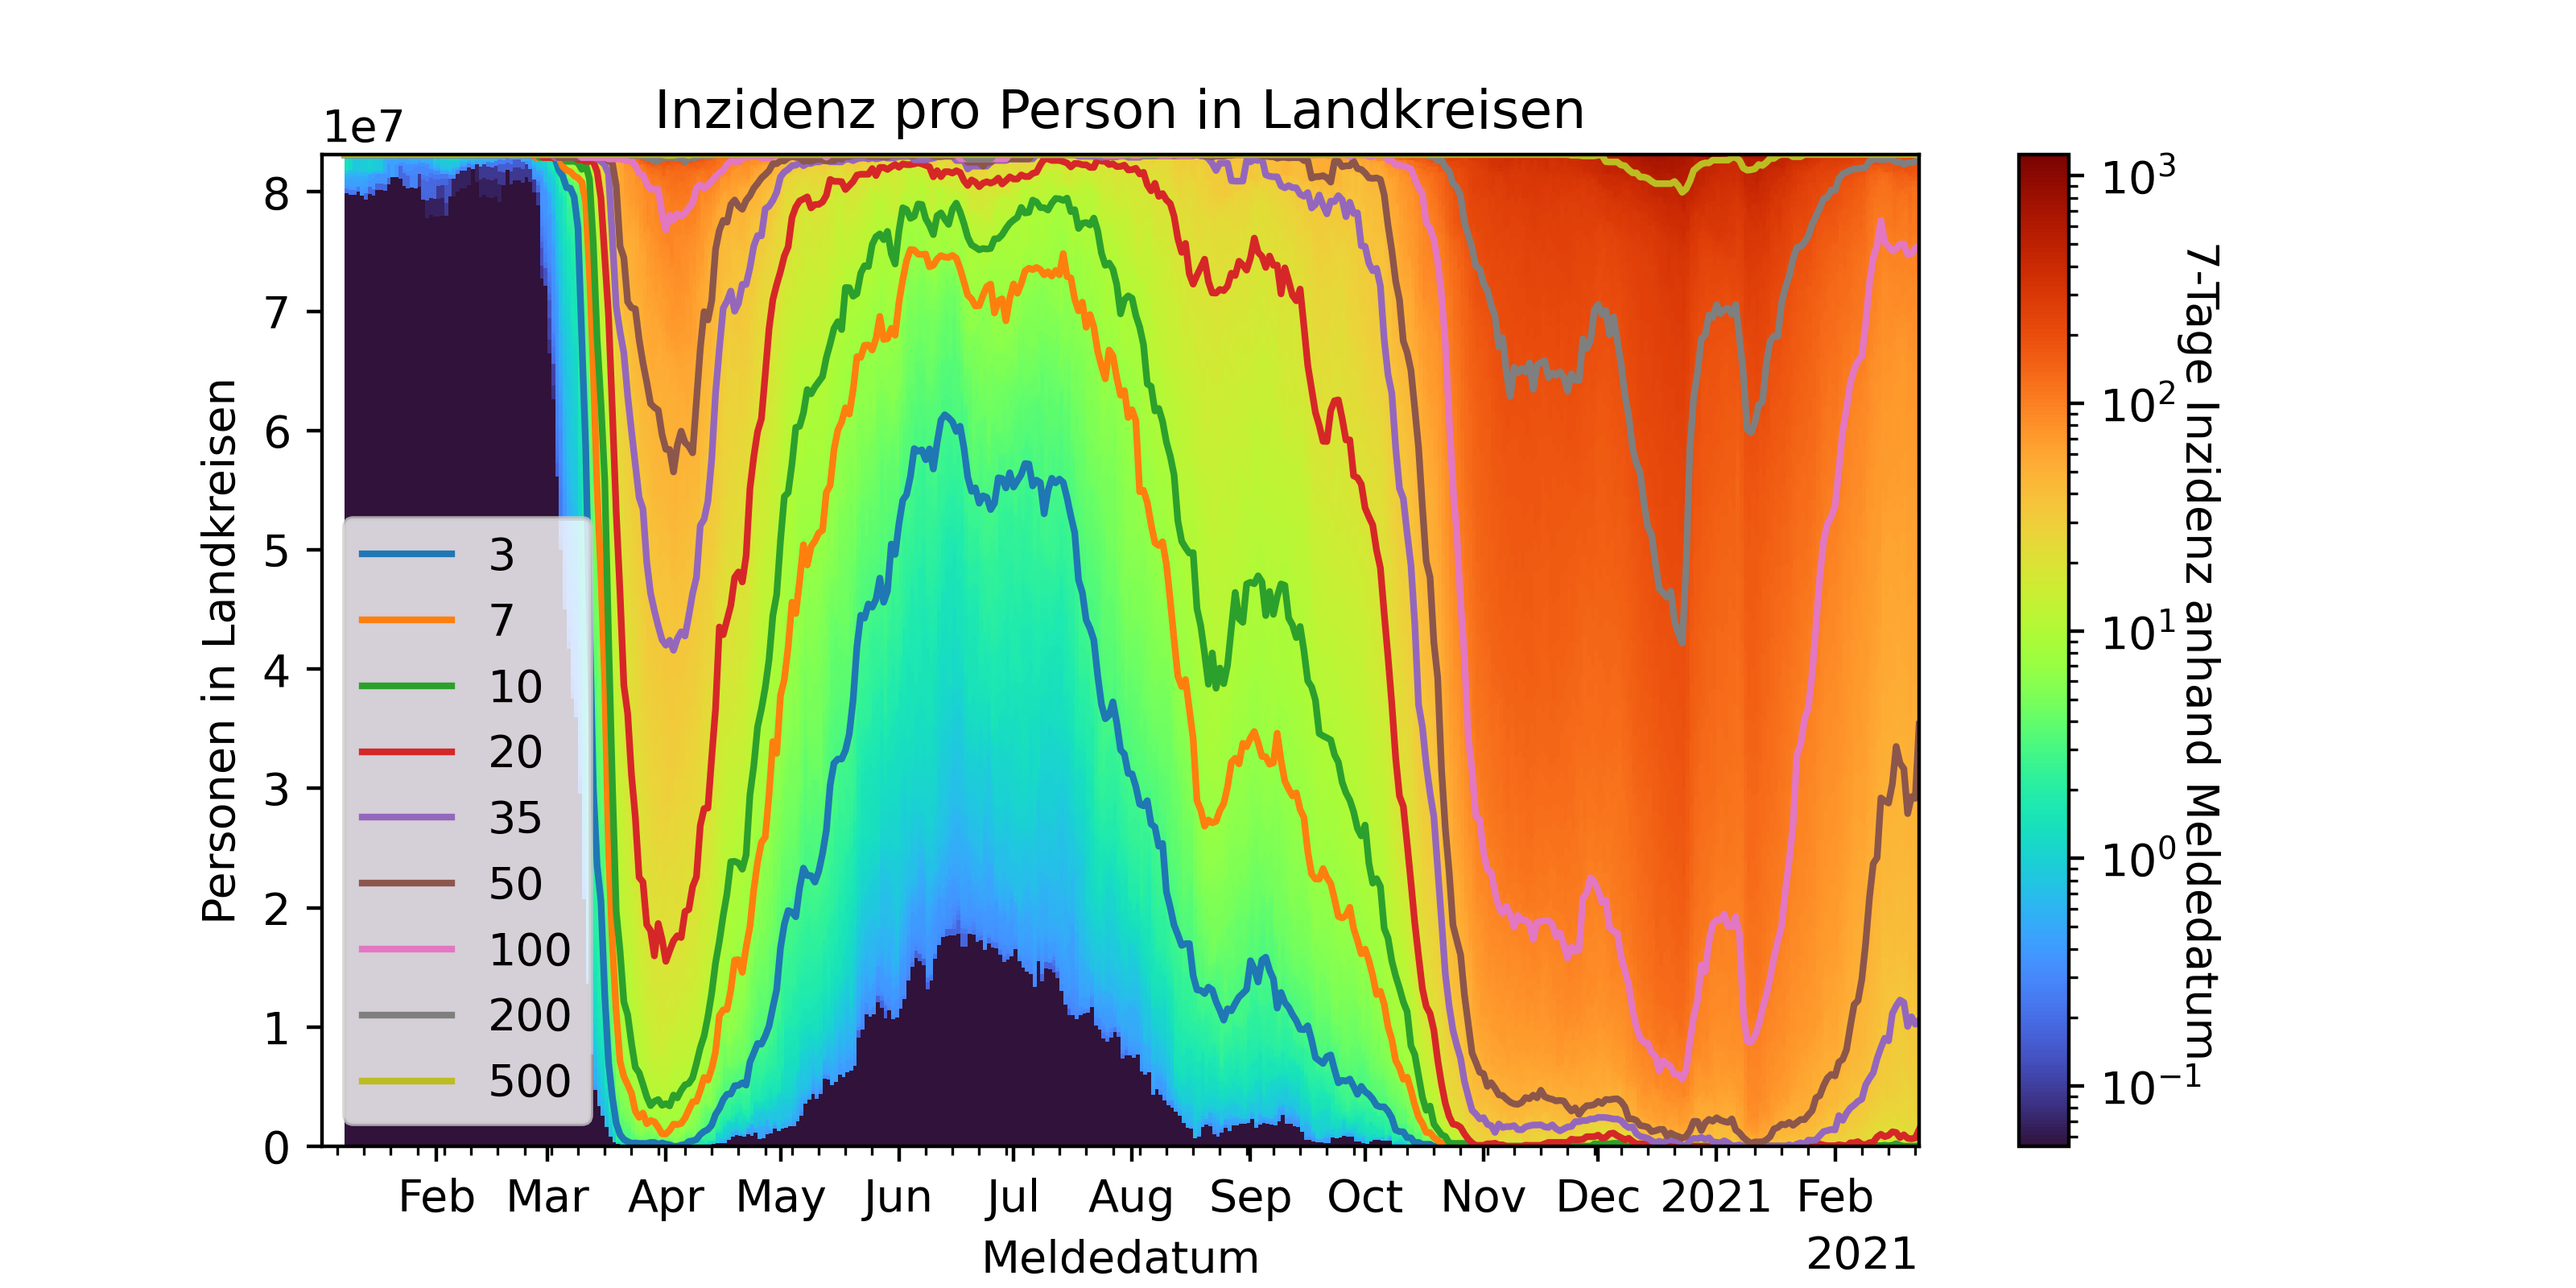
Verwende die `full-data.csv` von pavelmayer.de/covid/risks/ um die Verteilung der Inzidenzen der Landkreise im zeitlichen Verlauf anhand ihrer Größe darzustellen. (Achtung, sehr schlechter Code...)
This file contains hidden or bidirectional Unicode text that may be interpreted or compiled differently than what appears below. To review, open the file in an editor that reveals hidden Unicode characters.
Learn more about bidirectional Unicode characters
| # -*- coding: utf-8 -*- | |
| import pandas as pd | |
| import numpy as np | |
| import datetime | |
| columns = [ | |
| 'IdBundesland', | |
| 'Bundesland', | |
| 'IdLandkreis', | |
| 'Landkreis', | |
| 'Meldedatum', | |
| 'AnzahlFall', | |
| 'Bevoelkerung', | |
| 'Refdatum', | |
| 'Datenstand', | |
| ] | |
| utctimestamparser = lambda x: datetime.datetime.utcfromtimestamp(int(x)/1000) | |
| df = pd.read_csv('full-data.csv', usecols = columns, parse_dates=['Meldedatum', 'Refdatum'], date_parser=utctimestamparser) | |
| bevoelkerung = df[['IdLandkreis','Bevoelkerung']].groupby(['IdLandkreis']).first()['Bevoelkerung'] | |
| df["Datenstand"] = pd.to_datetime(df['Datenstand'],format="%d.%m.%Y, %H:%S Uhr") | |
| dff = df[['IdBundesland','IdLandkreis','AnzahlFall','Meldedatum']] | |
| dff = dff[dff['AnzahlFall'] > 0] | |
| dff = dff.set_index(['IdLandkreis', 'Meldedatum'])['AnzahlFall'] | |
| dff = dff.groupby(level='IdLandkreis').resample('1d',level='Meldedatum').sum() | |
| dff = dff.reindex(pd.MultiIndex.from_product([dff.index.levels[0],dff.index.levels[1]],names=['IdLandkreis','Meldedatum']), fill_value=0) | |
| sum_7day = dff.groupby(level='IdLandkreis').apply(lambda x: x.rolling(7).sum()) | |
| inzidenz = (sum_7day / bevoelkerung * 100000).dropna() | |
| inzidenz = inzidenz.swaplevel(0,1) | |
| inzidenz = inzidenz.dropna().sort_index().rename('Inzidenz') | |
| inzidenz = inzidenz.to_frame() | |
| inzidenz = inzidenz.sort_values(['Meldedatum', 'Inzidenz']) | |
| import matplotlib | |
| import matplotlib.pyplot as plt | |
| from matplotlib.collections import PatchCollection | |
| from matplotlib.patches import Rectangle | |
| rectangles = []; | |
| colors = []; | |
| breakpointx = [] | |
| breakpoints = [3, 7, 10, 20, 35, 50, 100, 200, 500] | |
| breakpointpoints = [[] for i in range(len(breakpoints))] | |
| for start in inzidenz.index.get_level_values('Meldedatum').unique(): | |
| #width = matplotlib.dates.date2num(end) - matplotlib.dates.date2num(start) | |
| width = 1 | |
| height = 0 | |
| breakpointindex = 0 | |
| breakpointheights = [] | |
| breakpointx.append(matplotlib.dates.date2num(start)) | |
| for i, (kreis, inz) in enumerate(inzidenz.loc[start, :].iterrows()): | |
| while breakpointindex < len(breakpoints) and inz[0] > breakpoints[breakpointindex]: | |
| breakpointheights.append(height) | |
| breakpointindex += 1 | |
| rectangles.append(Rectangle((matplotlib.dates.date2num(start), height), width, bevoelkerung[kreis])) | |
| height += bevoelkerung[kreis] | |
| colors.append(inz[0]) | |
| while breakpointindex < len(breakpoints): | |
| breakpointheights.append(height) | |
| breakpointindex += 1 | |
| for i, height in enumerate(breakpointheights): | |
| breakpointpoints[i].append(height) | |
| import copy | |
| cmap = copy.copy(matplotlib.cm.turbo) | |
| cmap.set_bad(cmap.colors[0]) | |
| fig = plt.figure(figsize=(8,4)) | |
| ax = fig.add_subplot(111) | |
| p = PatchCollection(rectangles, cmap=cmap, | |
| norm=matplotlib.colors.LogNorm() | |
| ) | |
| p.set_array(np.array(colors)) | |
| ax.add_collection(p) | |
| cb = plt.colorbar(p) | |
| cb.set_label('7-Tage Inzidenz anhand Meldedatum', rotation=270) | |
| import matplotlib.units as munits | |
| import matplotlib.dates as mdates | |
| converter = mdates.ConciseDateConverter() | |
| munits.registry[np.datetime64] = converter | |
| munits.registry[datetime.date] = converter | |
| munits.registry[datetime.datetime] = converter | |
| # assign date locator / formatter to the x-axis to get proper labels | |
| locator = mdates.MonthLocator() | |
| formatter = mdates.ConciseDateFormatter(locator) | |
| ax.xaxis.set_major_locator(locator) | |
| ax.xaxis.set_major_formatter(formatter) | |
| ax.xaxis.set_minor_locator(mdates.WeekdayLocator(matplotlib.dates.MO)) | |
| for i, breakpoint in enumerate(breakpoints): | |
| plt.plot(breakpointx, breakpointpoints[i], label=f"{breakpoint}") | |
| plt.xlim([ | |
| matplotlib.dates.date2num(inzidenz.index.levels[0].min()), | |
| matplotlib.dates.date2num(inzidenz.index.levels[0].max()) | |
| ]) | |
| plt.ylim([0, bevoelkerung.sum()]) | |
| plt.title("Inzidenz pro Person in Landkreisen") | |
| plt.ylabel("Personen in Landkreisen") | |
| plt.xlabel("Meldedatum") | |
| plt.legend() | |
| #plt.show() | |
| plt.savefig('./output.png', dpi=400) |
Author
Sign up for free
to join this conversation on GitHub.
Already have an account?
Sign in to comment
Ausgabe: