Created
August 31, 2023 00:55
-
-
Save MattCowgill/560c1e6ce00b1f1fdcdc9b045ffdea75 to your computer and use it in GitHub Desktop.
This file contains hidden or bidirectional Unicode text that may be interpreted or compiled differently than what appears below. To review, open the file in an editor that reveals hidden Unicode characters.
Learn more about bidirectional Unicode characters
| library(fredr) | |
| library(tidyverse) | |
| library(ggdirectlabel) # remotes::install_github("mattcowgill/ggdirectlabel") | |
| # You must have a FRED API key; | |
| # see http://sboysel.github.io/fredr/articles/fredr.html | |
| us_cpi <- fredr("CPIAUCSL") | |
| us_sent <- fredr("UMCSENT") |> | |
| select(date, sentiment = value) |> | |
| filter(!is.na(sentiment)) | |
| my_theme <- theme_minimal(base_family = "Roboto Condensed", | |
| base_size = 16) %+replace% | |
| theme(plot.title.position = "plot", | |
| plot.caption.position = "plot", | |
| plot.caption = element_text(hjust = 0, | |
| size = rel(0.5)), | |
| plot.title = ggtext::element_textbox_simple( | |
| size = rel(1.25), | |
| hjust = 0, | |
| vjust = 1, | |
| face = "bold" | |
| ), | |
| plot.subtitle = ggtext::element_textbox_simple( | |
| colour = "grey30", | |
| size = rel(1), | |
| hjust = 0, | |
| vjust = 1 | |
| )) | |
| delta_inf <- us_cpi |> | |
| select(date, cpi = value) |> | |
| arrange(date) |> | |
| mutate(inf = (cpi / lag(cpi, 12L, order_by = date)) - 1, | |
| ave_inf = slider::slide_mean(inf, before = 119L, complete = TRUE), | |
| delta_inf = inf - ave_inf) |> | |
| filter(!is.na(delta_inf)) | |
| comb <- delta_inf |> | |
| right_join(us_sent, | |
| by = 'date') |> | |
| mutate(decade = paste0(str_sub(format(date, "%Y"), 1, 3), | |
| "0s")) | |
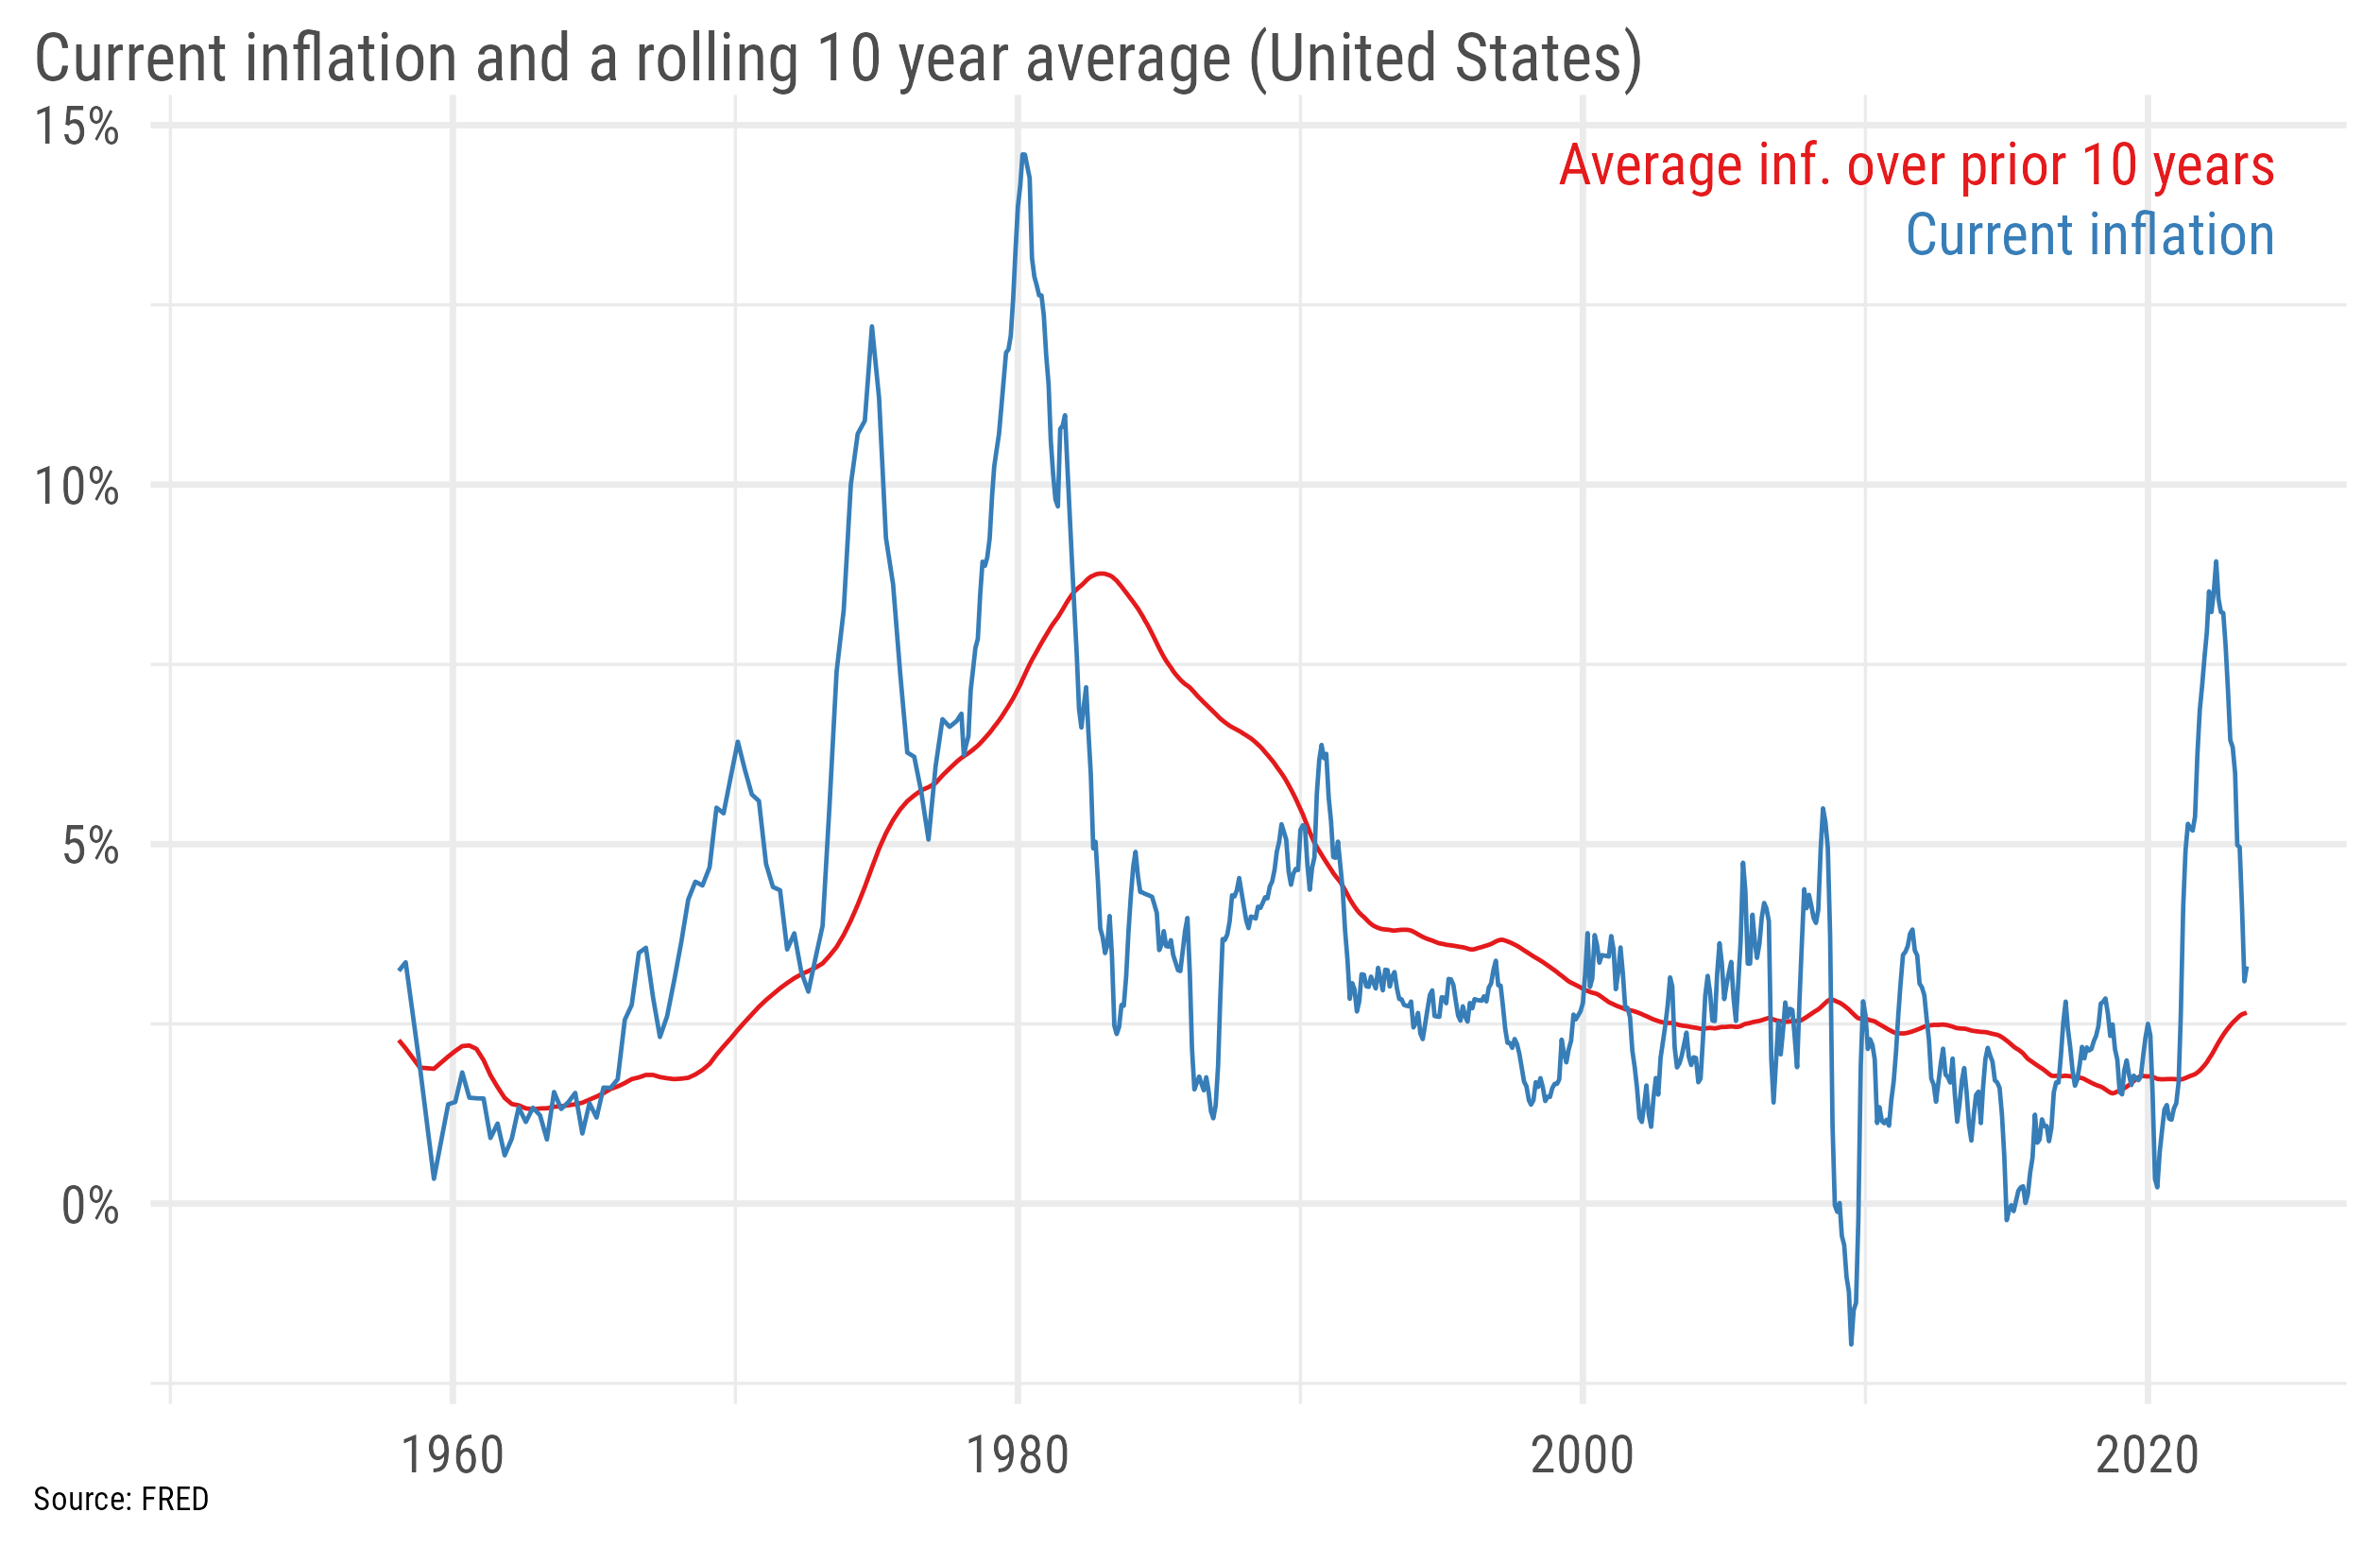
| plot_inf <- comb |> | |
| select(date, | |
| `Average inf. over prior 10 years` = ave_inf, | |
| `Current inflation` = inf) |> | |
| pivot_longer(!date) |> | |
| ggplot(aes(x = date, y = value, col = name)) + | |
| geom_line() + | |
| geom_richlegend(aes(label = name), | |
| family = "Roboto Condensed", | |
| size = 14 / .pt) + | |
| my_theme + | |
| scale_y_continuous(labels = scales::percent) + | |
| scale_colour_brewer(palette="Set1") + | |
| theme(legend.position = "none", | |
| axis.title = element_blank()) + | |
| labs(subtitle = "Current inflation and a rolling 10 year average (United States)", | |
| caption = "Source: FRED") | |
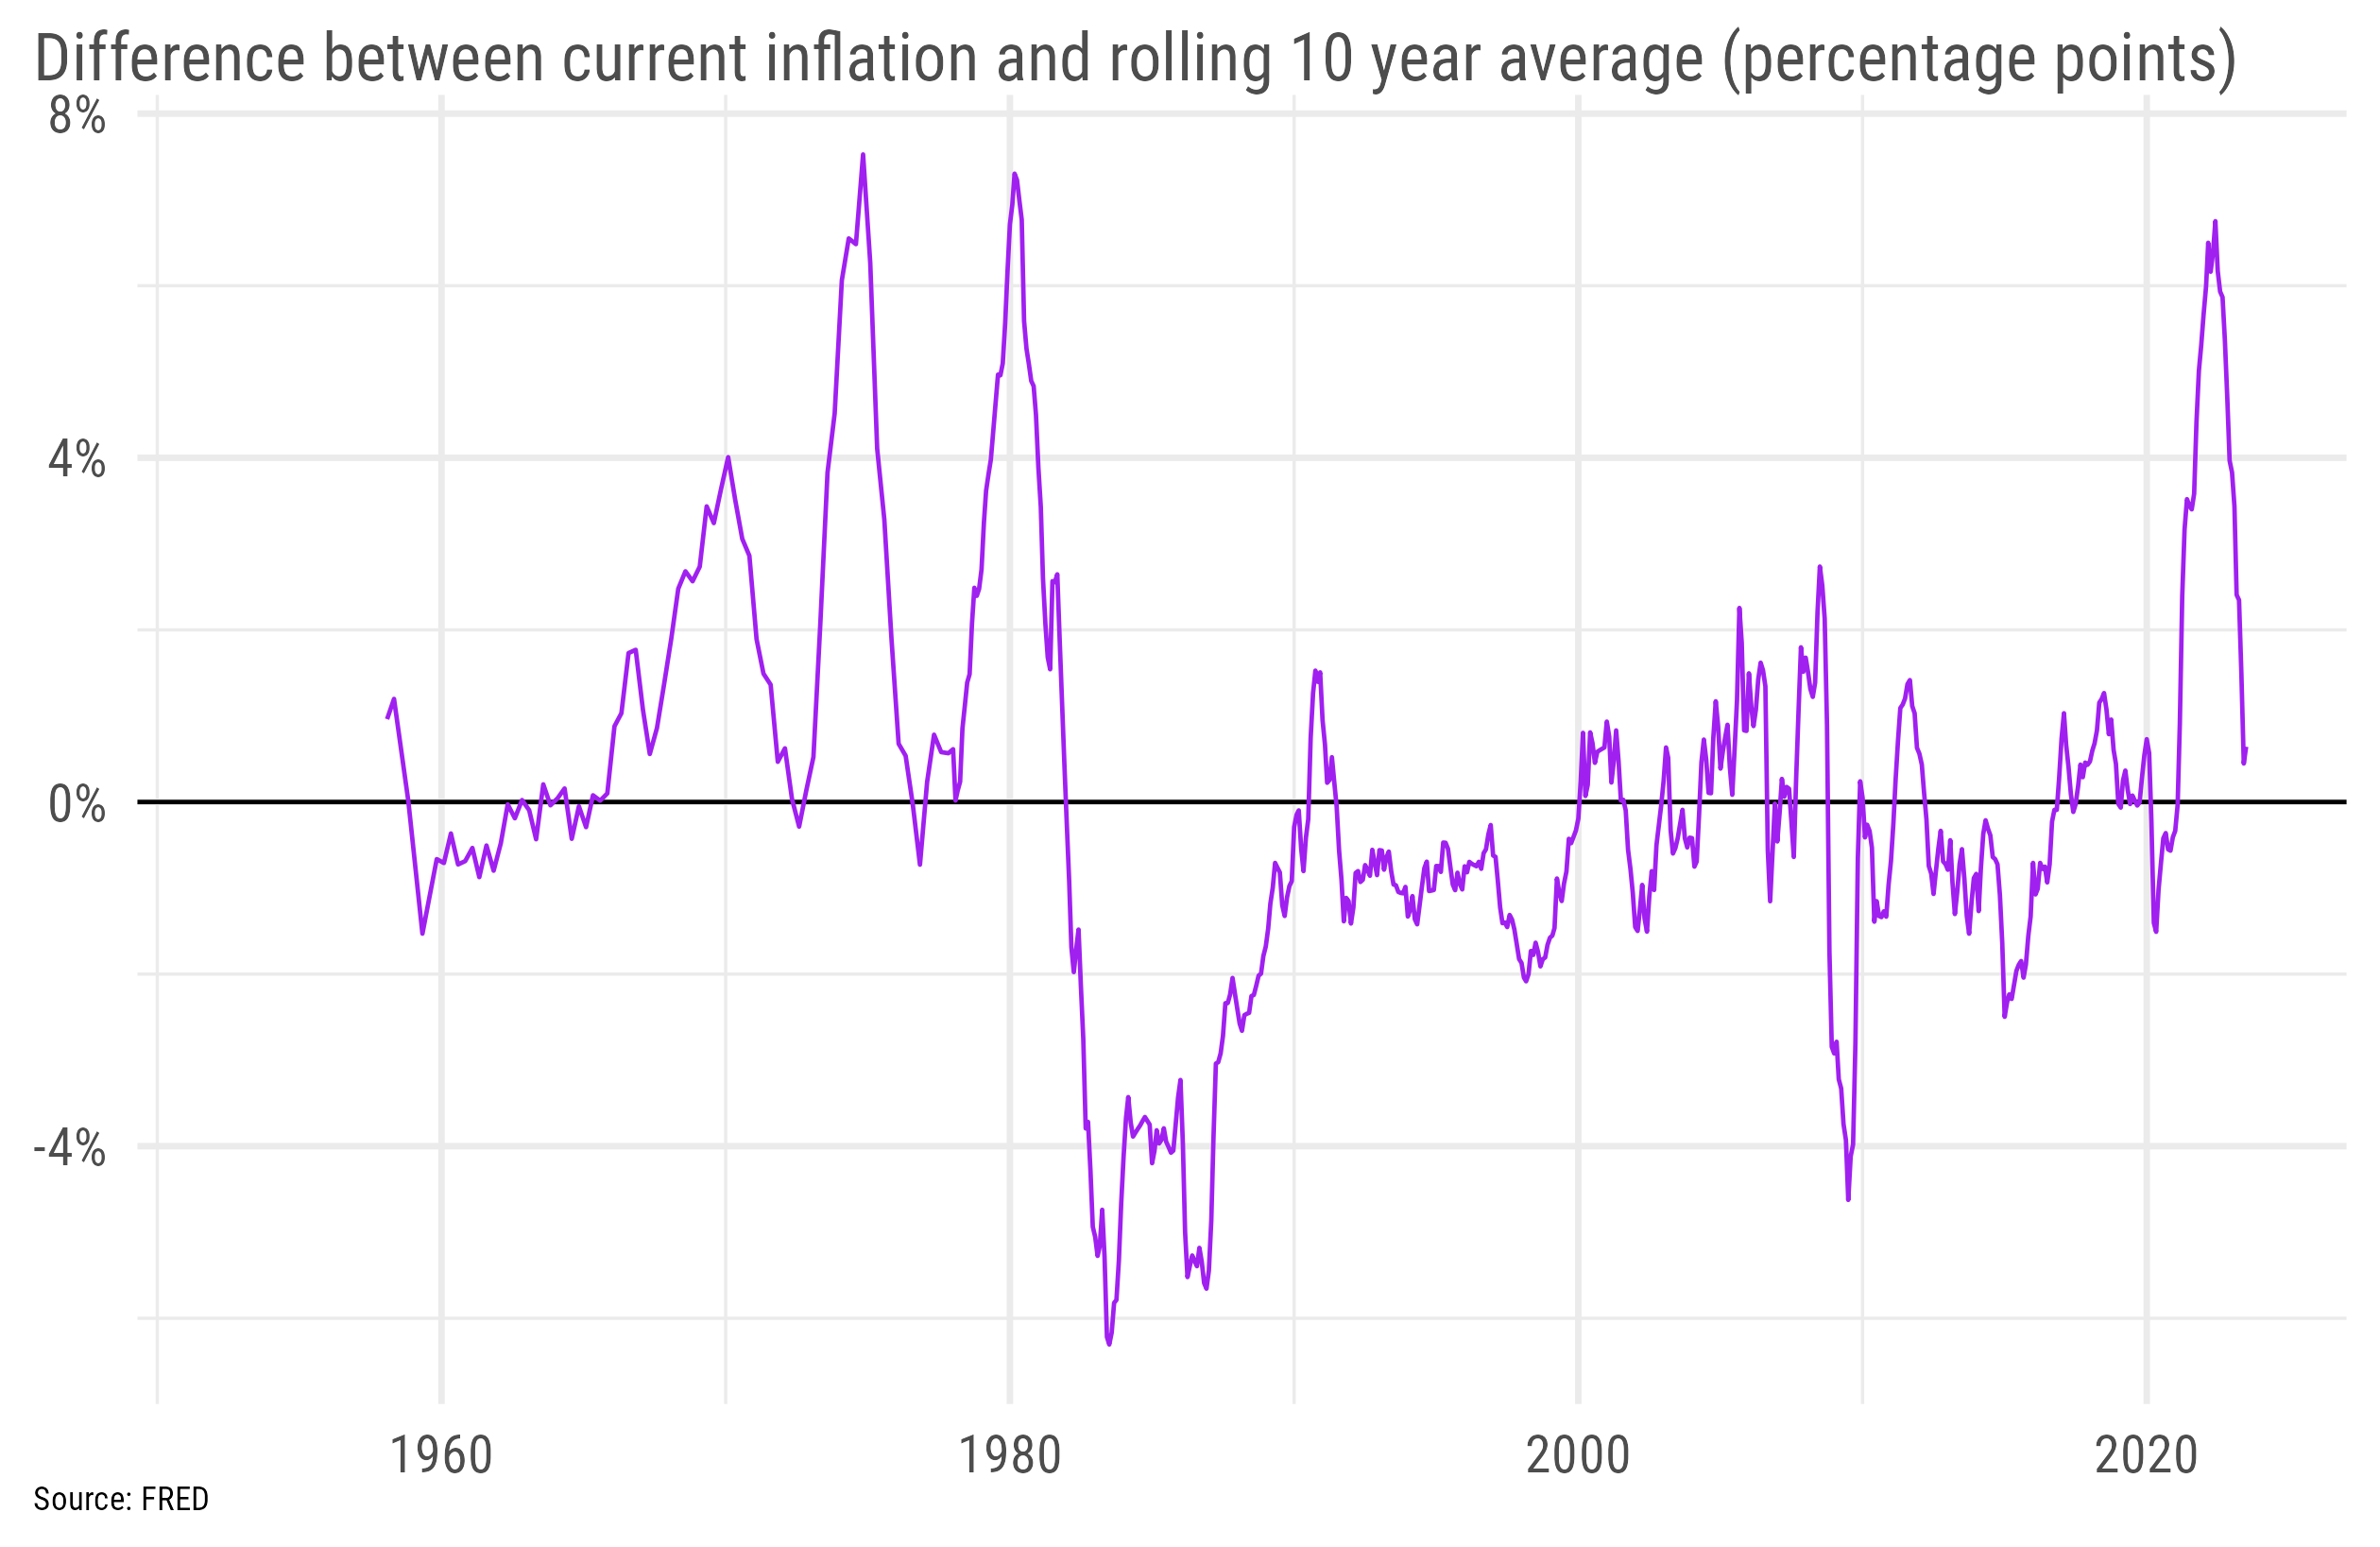
| plot_inf_diff <- comb |> | |
| ggplot(aes(x = date, y = delta_inf)) + | |
| geom_hline(yintercept = 0) + | |
| geom_line(colour = "purple") + | |
| my_theme + | |
| scale_y_continuous(labels = scales::percent) + | |
| theme(axis.title = element_blank()) + | |
| labs(subtitle = "Difference between current inflation and rolling 10 year average (percentage points)", | |
| caption = "Source: FRED") | |
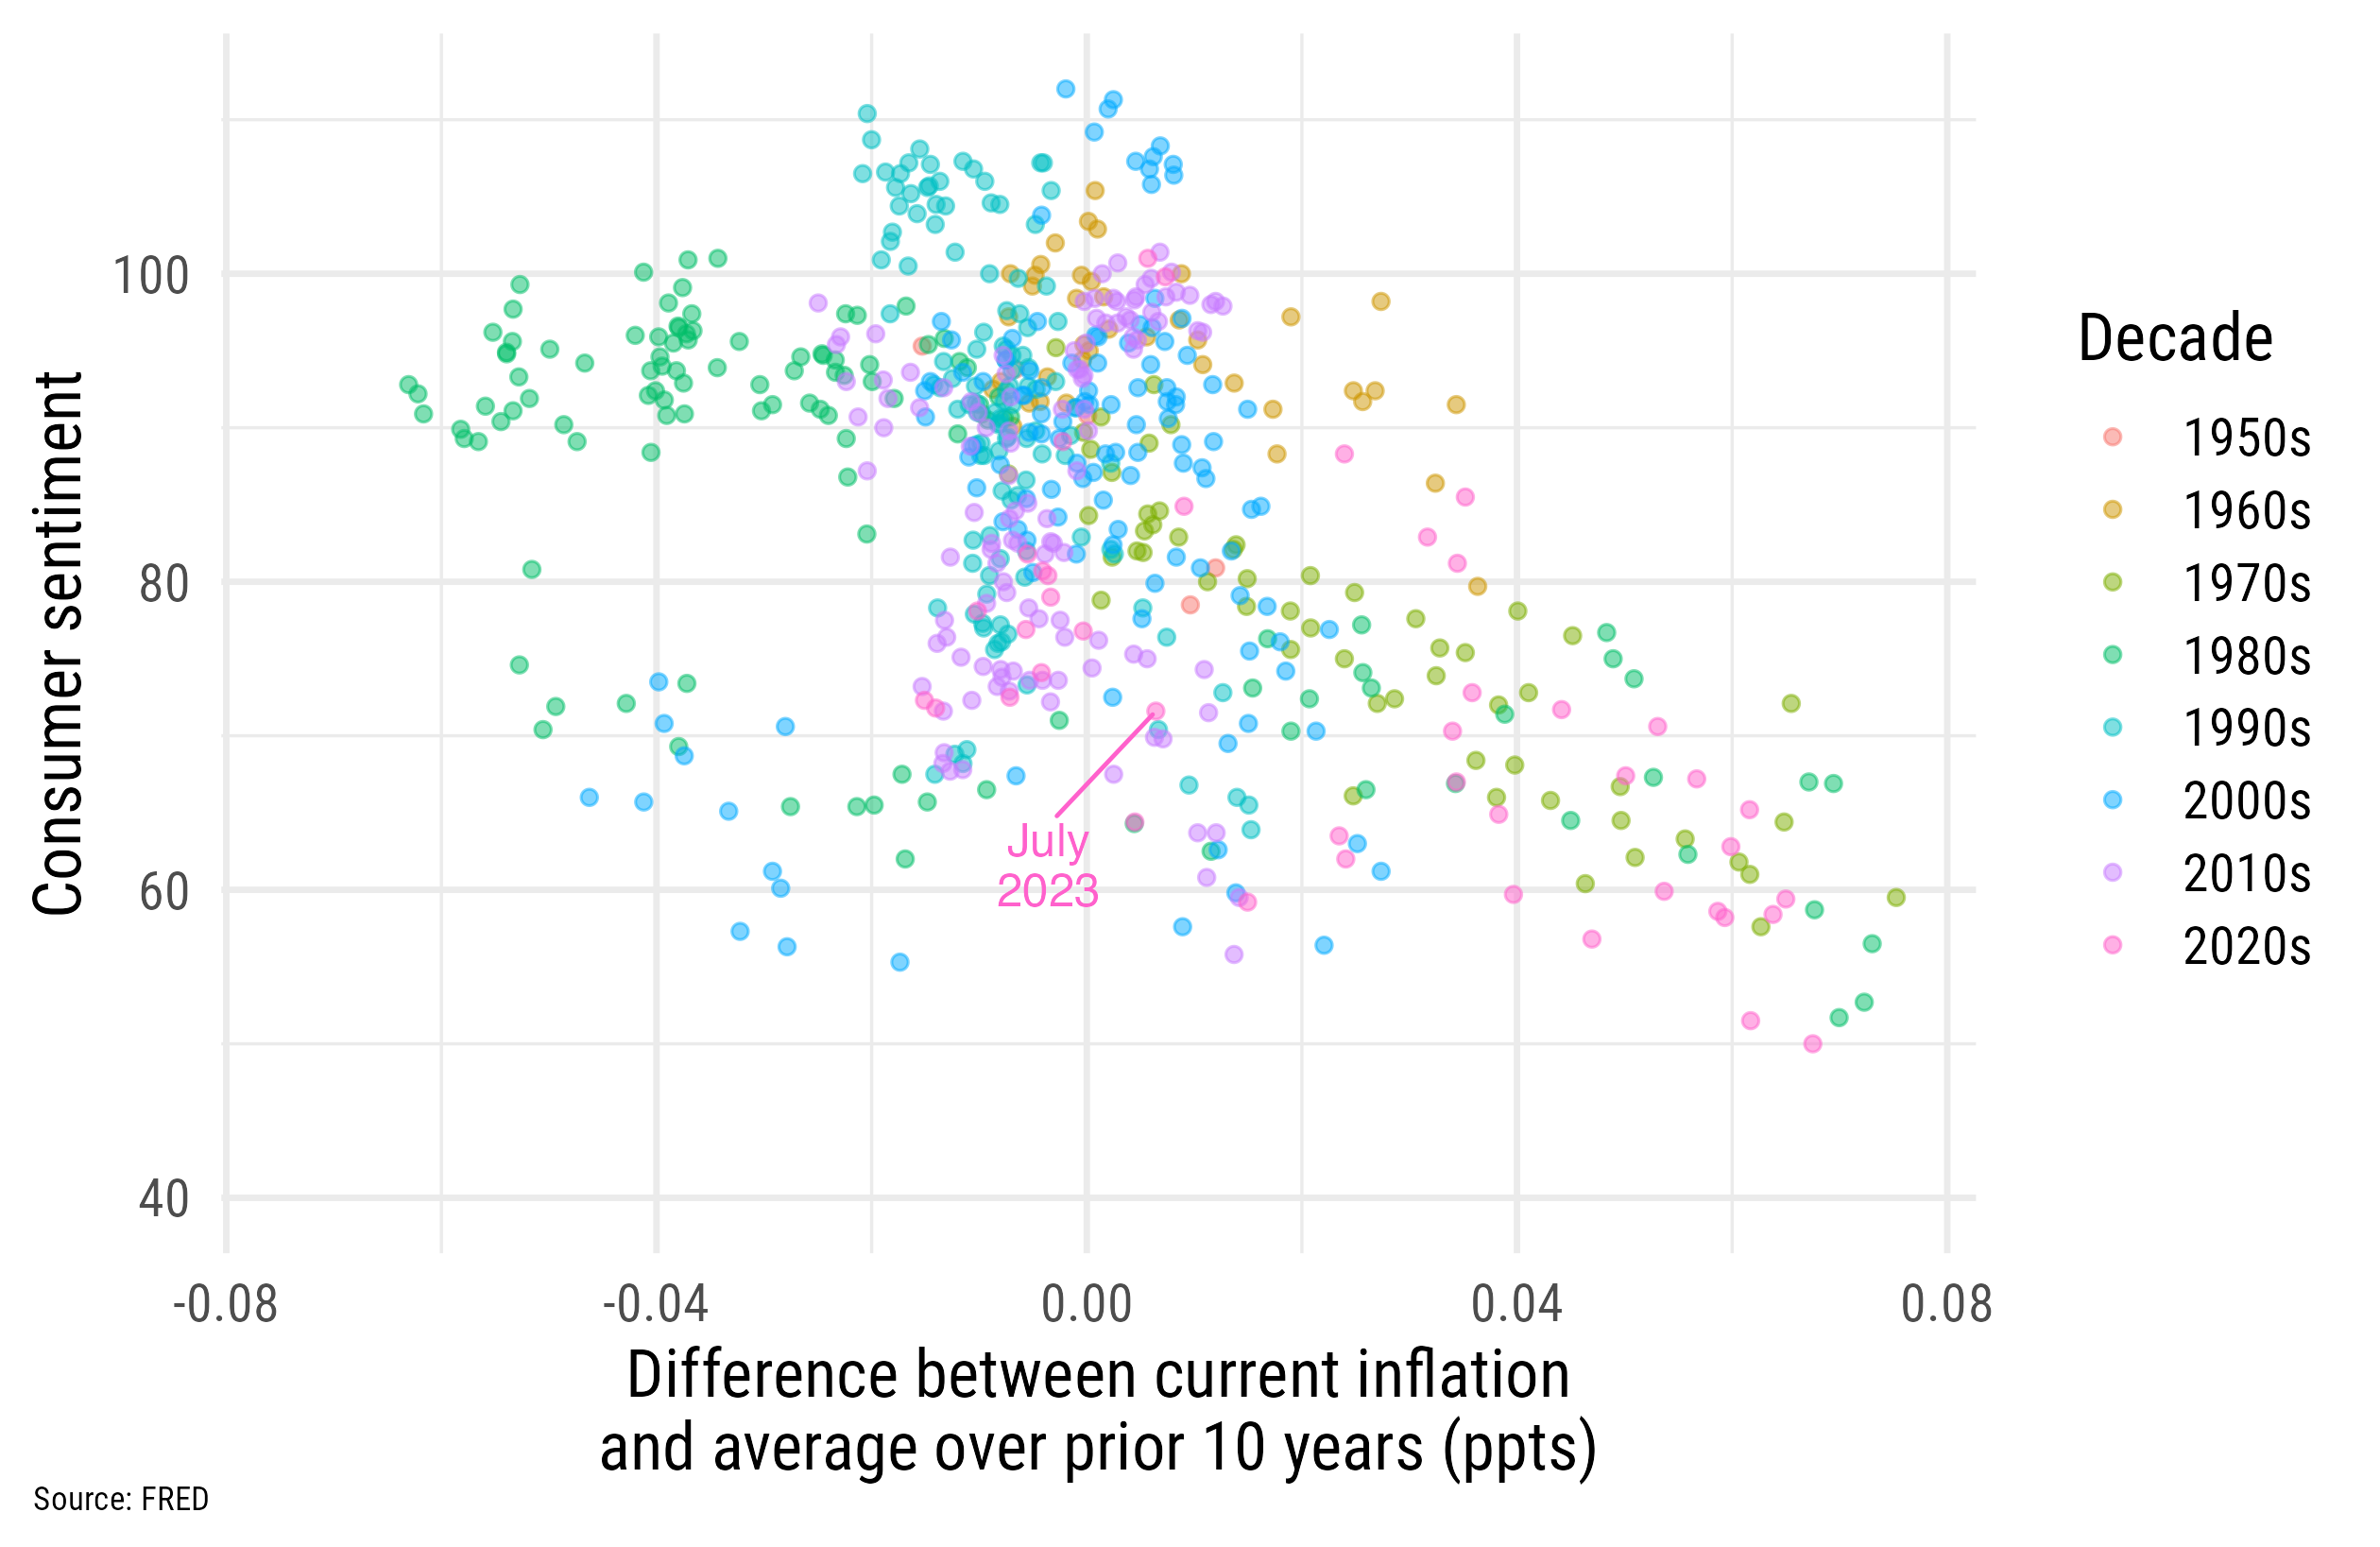
| plot_scatter <- comb |> | |
| rename(Decade = decade) |> | |
| ggplot(aes(x = delta_inf, | |
| y = sentiment, | |
| col = Decade)) + | |
| geom_point(alpha = 0.5) + | |
| ggrepel::geom_text_repel(data = ~mutate(., | |
| label = if_else(date == max(date), | |
| format(date, "%B\n%Y"), | |
| "")), | |
| aes(label = label), | |
| min.segment.length = 0, | |
| lineheight = 0.9, | |
| nudge_x = -.01, | |
| nudge_y = -10, | |
| max.overlaps = 10000, | |
| show.legend = FALSE) + | |
| my_theme + | |
| labs(x = "Difference between current inflation\nand average over prior 10 years (ppts)", | |
| y = "Consumer sentiment", | |
| caption = "Source: FRED") | |
| my_save <- function(filename, plot) { | |
| ggsave(filename, plot, | |
| width = 20, height = 13, units = "cm", dpi = "retina", bg = "white") | |
| } | |
| my_save("plot_inf.png", plot_inf) | |
| my_save("plot_inf_diff.png", plot_inf_diff) | |
| my_save("plot_scatter.png", plot_scatter) |
Author
MattCowgill
commented
Aug 31, 2023
Sign up for free
to join this conversation on GitHub.
Already have an account?
Sign in to comment