Created
June 12, 2023 23:20
-
-
Save MattCowgill/5fccbc9bb97741152defa1d73017d461 to your computer and use it in GitHub Desktop.
This file contains hidden or bidirectional Unicode text that may be interpreted or compiled differently than what appears below. To review, open the file in an editor that reveals hidden Unicode characters.
Learn more about bidirectional Unicode characters
| library(tidyverse) | |
| library(gtrendsR) | |
| inf <- gtrends( | |
| keyword = "inflation", | |
| geo = c("AU", "US"), | |
| onlyInterest = TRUE) %>% | |
| magrittr::extract2("interest_over_time") %>% | |
| dplyr::as_tibble() %>% | |
| dplyr::mutate(date = as.Date(date)) | |
| inf |> | |
| group_by(geo) |> | |
| mutate(hits_ma = slider::slide_mean(hits, before = 3L, complete = T), | |
| geo = if_else(geo == "AU", "Australia", geo)) |> | |
| ggplot(aes(x = date, y = hits, col = geo)) + | |
| geom_line(alpha = 0.33, linetype = 2) + | |
| geom_line(aes(y = hits_ma)) + | |
| ggdirectlabel::scale_x_date_rightalign(expand = expansion(0.025)) + | |
| hrbrthemes::theme_ipsum_rc(base_size = 16) + | |
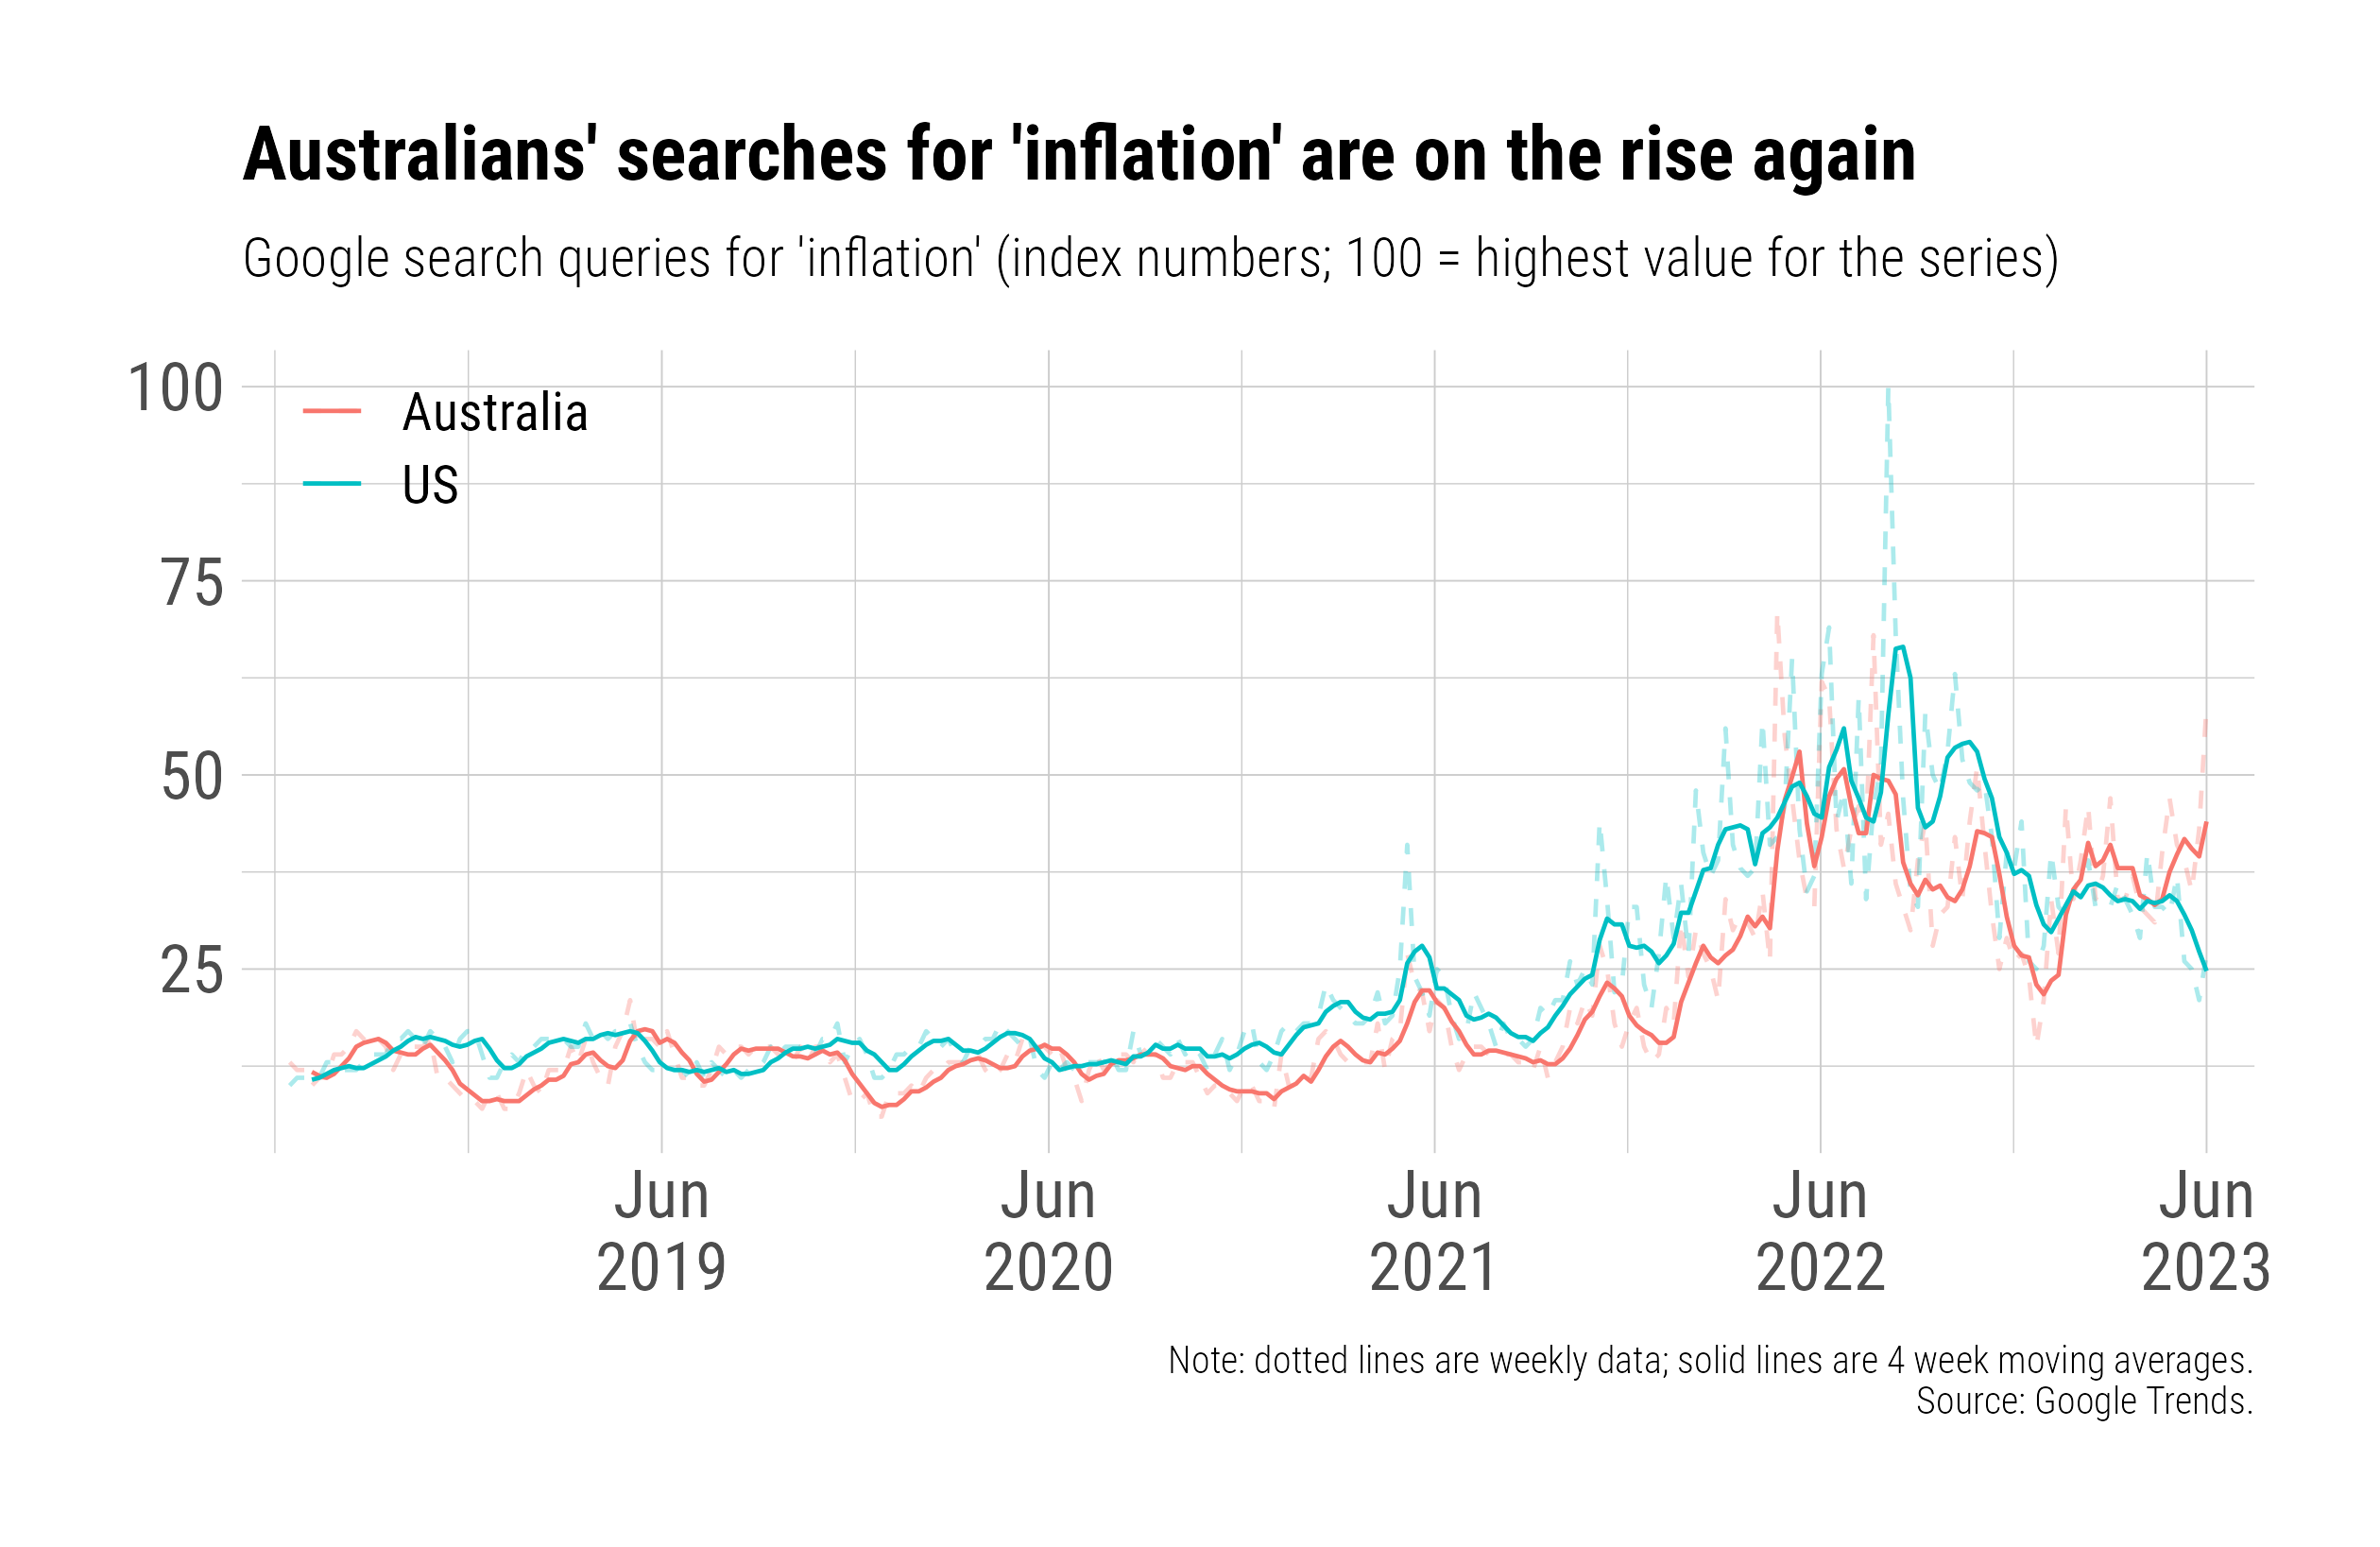
| labs(caption = "Note: dotted lines are weekly data; solid lines are 4 week moving averages.\nSource: Google Trends.", | |
| subtitle = "Google search queries for 'inflation' (index numbers; 100 = highest value for the series)", | |
| title = "Australians' searches for 'inflation' are on the rise again") + | |
| theme(legend.title = element_blank(), | |
| legend.position = c(0.1, 0.9), | |
| axis.title.x = element_blank(), | |
| axis.title.y = element_blank()) |
Author
MattCowgill
commented
Jun 12, 2023
Sign up for free
to join this conversation on GitHub.
Already have an account?
Sign in to comment