Created
May 21, 2023 10:22
-
-
Save MattCowgill/a601d10e650f44510ecffb14715475c2 to your computer and use it in GitHub Desktop.
This file contains hidden or bidirectional Unicode text that may be interpreted or compiled differently than what appears below. To review, open the file in an editor that reveals hidden Unicode characters.
Learn more about bidirectional Unicode characters
| library(tidyverse) | |
| library(readxl) | |
| library(lubridate) | |
| dl_file <- function(date) { | |
| month_year <- format(date, "%b-%Y") |> | |
| tolower() | |
| file_format <- if_else(date <= ymd("2021-03-01"), | |
| ".xls", | |
| ".xlsx") | |
| url <- paste0("https://www.abs.gov.au/statistics/labour/employment-and-unemployment/labour-force-australia/", | |
| month_year, | |
| "/Insights%20from%20the%20original%20data", | |
| file_format) | |
| path <- tempfile(fileext = file_format) | |
| download.file(url, path, mode = "wb") | |
| return(path) | |
| } | |
| import_sheet <- function(path, sheet) { | |
| raw_df <- read_excel(path, sheet = sheet, range = "A6:D8", col_names = F, | |
| .name_repair = "minimal") | |
| table_title <- read_excel(path, sheet = sheet, range = "A4", | |
| col_names = c("raw_title"), | |
| .name_repair = "minimal") | |
| metadata <- table_title |> | |
| mutate(title = str_remove_all(raw_title, ".*\\.")) |> | |
| separate(title, into = c("metric", "months", "series_type"), sep = ",") |> | |
| separate(months, into = c("month_1", "month_2"), sep = " - ") |> | |
| mutate(across(everything(), str_squish)) |> | |
| select(metric, month_1, month_2) |> | |
| pivot_longer(cols = starts_with("month"), | |
| names_to = "month_type", | |
| values_to = "month") | |
| month_1 <- raw_df |> | |
| select(sample = 1, | |
| value = 2) |> | |
| mutate(month_type = "month_1") | |
| month_2 <- raw_df |> | |
| select(sample = 3, | |
| value = 4) |> | |
| mutate(month_type = "month_2") | |
| dat <- bind_rows(month_1, month_2) | |
| dat |> | |
| left_join(metadata, by = "month_type") |> | |
| select(-month_type) | |
| } | |
| import_file <- function(path) { | |
| map_dfr(c("Data1", "Data2", "Data3"), | |
| import_sheet, | |
| path = path) | |
| } | |
| files <- seq.Date(from = ymd("2023-04-01"), | |
| to = ymd("2020-06-01"), | |
| by = "-1 month") |> | |
| map_chr(dl_file, | |
| .progress = TRUE) | |
| raw_data <- map_dfr(files, import_file, | |
| .progress = TRUE) |> | |
| mutate(date = dmy(paste0("01 ", month))) |> | |
| select(-month) | |
| urs <- raw_data |> | |
| filter(sample %in% c("Outgoing rotation group", | |
| "Incoming rotation group")) |> | |
| group_by(date, sample) |> | |
| summarise(ur = value[metric == "Unemployed"] / | |
| (value[metric == "Unemployed"] + value[metric == "Employed"])) |> | |
| ungroup() | |
| urs |> | |
| pivot_wider(names_from = sample, | |
| values_from = ur) |> | |
| mutate(`Outgoing rotation group` = lag(`Outgoing rotation group`), | |
| diff = `Incoming rotation group` - `Outgoing rotation group`) |> | |
| ggplot(aes(x = date, y = diff)) + | |
| geom_hline(yintercept = 0) + | |
| geom_col() + | |
| scale_y_continuous(labels = \(x) paste0(x * 100, " ppts")) + | |
| scale_x_date(breaks = seq(max(urs$date), | |
| min(urs$date), | |
| "-1 year"), | |
| date_labels = "%b\n%Y") + | |
| theme_minimal() + | |
| theme(panel.grid.minor = element_blank(), | |
| axis.title = element_blank()) + | |
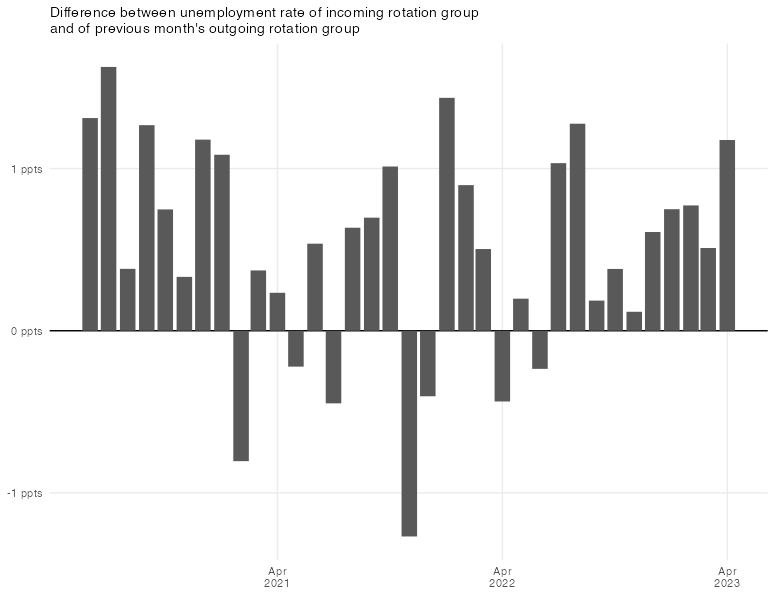
| labs(subtitle = "Difference between unemployment rate of incoming rotation group\nand of previous month's outgoing rotation group") |
Author
MattCowgill
commented
May 21, 2023
Sign up for free
to join this conversation on GitHub.
Already have an account?
Sign in to comment