-
-
Save PaulC91/2a1b9ba57a53869ba82093720a9a8fa0 to your computer and use it in GitHub Desktop.
| library(shiny) | |
| library(shinyauthr) | |
| library(shinyjs) | |
| user_base <- data.frame( | |
| user = c("user1", "user2"), | |
| password = c("pass1", "pass2"), | |
| permissions = c("admin", "standard"), | |
| name = c("User One", "User Two"), | |
| stringsAsFactors = FALSE | |
| ) | |
| ui <- tagList( | |
| shinyjs::useShinyjs(), | |
| tags$head(includeScript("logout-button.js")), | |
| navbarPage( | |
| id = "tabs", | |
| title = "shinyauthr with Navbar Page", | |
| tabPanel("Home", loginUI("login"), uiOutput("homepage")), | |
| tabPanel("Data", tableOutput("tbl")) | |
| ) | |
| ) | |
| server <- function(input, output, session) { | |
| # go back to the home tab after logout | |
| observeEvent(credentials()$user_auth, { | |
| updateNavbarPage(session, "tabs", selected = "Home") | |
| }) | |
| # call the logout module with reactive trigger to hide/show | |
| logout_init <- callModule(logout, | |
| id = "logout", | |
| active = reactive(credentials()$user_auth)) | |
| # call login module supplying data frame, user and password cols | |
| # and reactive trigger | |
| credentials <- callModule(login, | |
| id = "login", | |
| data = user_base, | |
| user_col = user, | |
| pwd_col = password, | |
| log_out = reactive(logout_init())) | |
| output$homepage <- renderUI({ | |
| req(credentials()$user_auth) | |
| tags$h1("Something in the homepage") | |
| }) | |
| output$tbl <- renderTable({ | |
| req(credentials()$user_auth) | |
| credentials()$info | |
| }) | |
| } | |
| shinyApp(ui, server) |
have the logout-button.js file in your main app directory then call it in your shiny ui function with tags$head(includeScript("logout-button.js")) just like the example above.
Hi Paul
I am getting the following error message:
cannot open file 'logout-button.js': No such file or directory
I created the file using Text editor and saved it as a .js file. Is it the correct way to do it?
Hi Paul, managed to sort it out.
Regards
Chris
Paul, i am still new to Shiny and R. How can i store the login credentials in a MySQL table and call them from the Shiny App?
Regards
Chris
Hi Chris, sorry I'm not available for shiny tuition at this time. I suggest you check out the various resources on the web that will help you learn. Here's one specific to databases in R: https://db.rstudio.com/
Hi Paul
Can one use Shinyauthr with a shiny dashboard and do you have use cases of this?
My dashboard looks like this:
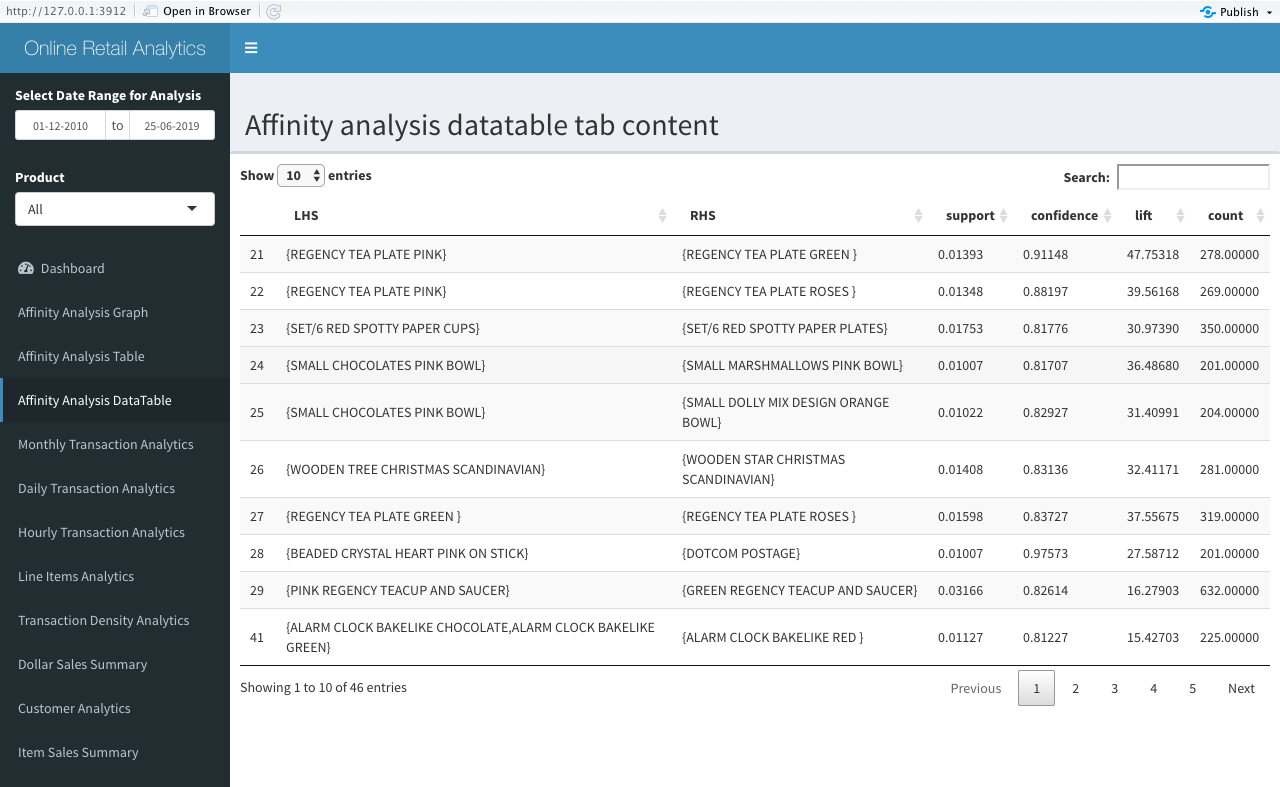
My code is as follows:
ui <- tagList(

  shinyjs::useShinyjs(),
  tags$head(includeScript("logout-button.js")),

  dashboardPage(
  dashboardHeader(title = "Online Retail Analytics"),
  dashboardSidebar(
    htmlOutput("rangeDate_selector"),
    htmlOutput("productName_selector"),
    # numericInput("stockout", 'Days Out of Stock', value = 30, min = 5, max = 120),
    # numericInput("top_N", 'Number of Top Products', value =10, min = 5, max = 50),
    sidebarMenu(
      menuItem("Dashboard", tabName = "dashboard", icon = icon("dashboard")),
      menuItem("Affinity Analysis Graph", tabName = "graph"),
      menuItem("Affinity Analysis Table", tabName = "table"),
      menuItem("Affinity Analysis DataTable", tabName = "DataTable"),
      menuItem("Monthly Transaction Analytics", tabName = "monthltrans"),
      menuItem("Daily Transaction Analytics", tabName = "weektrans"),
      menuItem("Hourly Transaction Analytics", tabName = "hourtrans"),
      menuItem("Line Items Analytics", tabName = "lineitems"),
      menuItem("Transaction Density Analytics", tabName = "transdensity"),
      menuItem("Dollar Sales Summary", tabName = "salesvalue"),
      menuItem("Customer Analytics", tabName = "customers"),
      menuItem("Item Sales Summary", tabName = "itemsales"),
      menuItem("Transaction Wait Analytics", tabName = "customerwait"),
      menuItem("Cost of Stock Outs", tabName = "stocks")
    )),
  dashboardBody(

    tabItems(
      tabItem(tabName = "dashboard",
              h2("Dashboard tab content"),
              fluidRow(
                valueBoxOutput("transactions")
              )),
      tabItem(tabName = "graph",
              h2("Affinity analysis graph tab content"),
              fluidRow(
                box(plotOutput("graphPlot"), width = 400, height = 700),
                box( radioButtons('samp', label='Sample', choices=c('All Rules', 'Sample'), inline=T), width = 3),
                box(numericInput("nrule", 'Number of Rules', 10), width = 3),
                box(radioButtons('graphType', label='Graph Type', choices=c('itemsets','items'), inline=T), width = 3)
              )),
      tabItem(tabName = "table",
              h2("Affinity analysis table tab content"),
              fluidRow(
                box(collapsible = TRUE,
                    verbatimTextOutput("rulesTable"), width = 400, height = 700),
                box(sliderInput("supp", "Support", min = 0,max = 1, value = 0.01, step = 1/10000), width = 3),
                box(sliderInput("conf", "Confidence", min = 0, max =  1, value = 0.8, step = 1/10000), width = 3),
                box(selectInput("sort", "Sorting Criteria:", choices = c('lift','confidence', 'support')), width = 3),
                box(numericInput("minL","Min items per set",2), width = 3),
                box(numericInput("maxL", "Max items per set", 4), width = 3)
              )),
      tabItem(tabName = "DataTable",
              h2("Affinity analysis datatable tab content"),
              fluidRow(
                box(dataTableOutput("rulesDataTable"), width = 400, height = 700)
              )),
      tabItem(tabName = "monthltrans",
              h2("Monthly transactions tab content"),
              fluidRow(
                box(plotOutput("TransMonthPlot"), width = 400, height = 700)
              )),
      tabItem(tabName = "hourtrans",
              h2("Hourly transactions tab content"),
              fluidRow(
                box(plotOutput("TransHourPlot"), width = 400, height = 700)
              )),
      tabItem(tabName = "weektrans",
              h2("Weekly transactions tab content"),
              fluidRow(
                box(plotOutput("TransWeekPlot"), width = 400, height = 700)
              )),
      tabItem(tabName = "lineitems",
              h2("Line item sales tab content"),
              fluidRow(
                box(plotOutput("ItemsPerDay"), width = 400, height = 700)
              )),
      tabItem(tabName = "transdensity",
              h2("Transactions density tab content"),
              fluidRow(
                box(plotOutput("TransDensityPerHour"), width = 400, height = 700)
              )),
        tabItem(tabName = "salesvalue",
            fluidRow(
            box(plotOutput("salesvaluePlot"))
          )),
        tabItem(tabName = "customers",
            fluidRow(
              box(plotOutput("monthlyCustomerPlot"))
            )),
        tabItem(tabName = "itemsales",
             fluidRow(
               box(dataTableOutput("salesDataTable"))
             ))
      #   tabItem(tabName = "customerwait",
      #         fluidRow(
      #           box(plotOutput("customerWait"))
      #         )),
      #   tabItem(tabName = "stocks",
      #         fluidRow(
      #           box(plotOutput("StockOutCost"))
      #         ))
      # )
    )

  ))
)
#> Error in tagList(shinyjs::useShinyjs(), tags$head(includeScript("logout-button.js")), : could not find function "tagList"
```

<sup>Created on 2019-07-18 by the [reprex package](https://reprex.tidyverse.org) (v0.3.0)</sup>`

I am not sure where and how to place the following code:

tabPanel("Home", loginUI("login"), uiOutput("homepage")),
    tabPanel("Data", tableOutput("tbl")),

There is an error with the "tagList" i tried to use.  I have managed to use shinyauthr with navbarPage with your assistance.

Regards

ChrisGood day Paul, i have managed to find your solution for this you posted on the R Studio Community. Once again, thank you very much for your valued contribution
glad to hear you found the solution you needed!
If anyone wants to know where the answer to the question is, it's here: https://community.rstudio.com/t/shinyauthr-with-shinydashboard-layout/30501/4
Hi Paul, i am having problems implementing the user authorization app. Where do i place the logout-button.js code?