Last active
May 6, 2019 13:46
-
-
Save PaulC91/f7e76a4dade52edf0c3034e87d200b40 to your computer and use it in GitHub Desktop.
make waffle bar charts (tiled bar charts?) in ggplot2 with numeric y-axis labels
This file contains hidden or bidirectional Unicode text that may be interpreted or compiled differently than what appears below. To review, open the file in an editor that reveals hidden Unicode characters.
Learn more about bidirectional Unicode characters
| remotes::install_github("paulc91/waffle", ref = "1.0.0") | |
| library(tidyverse) | |
| library(waffle) | |
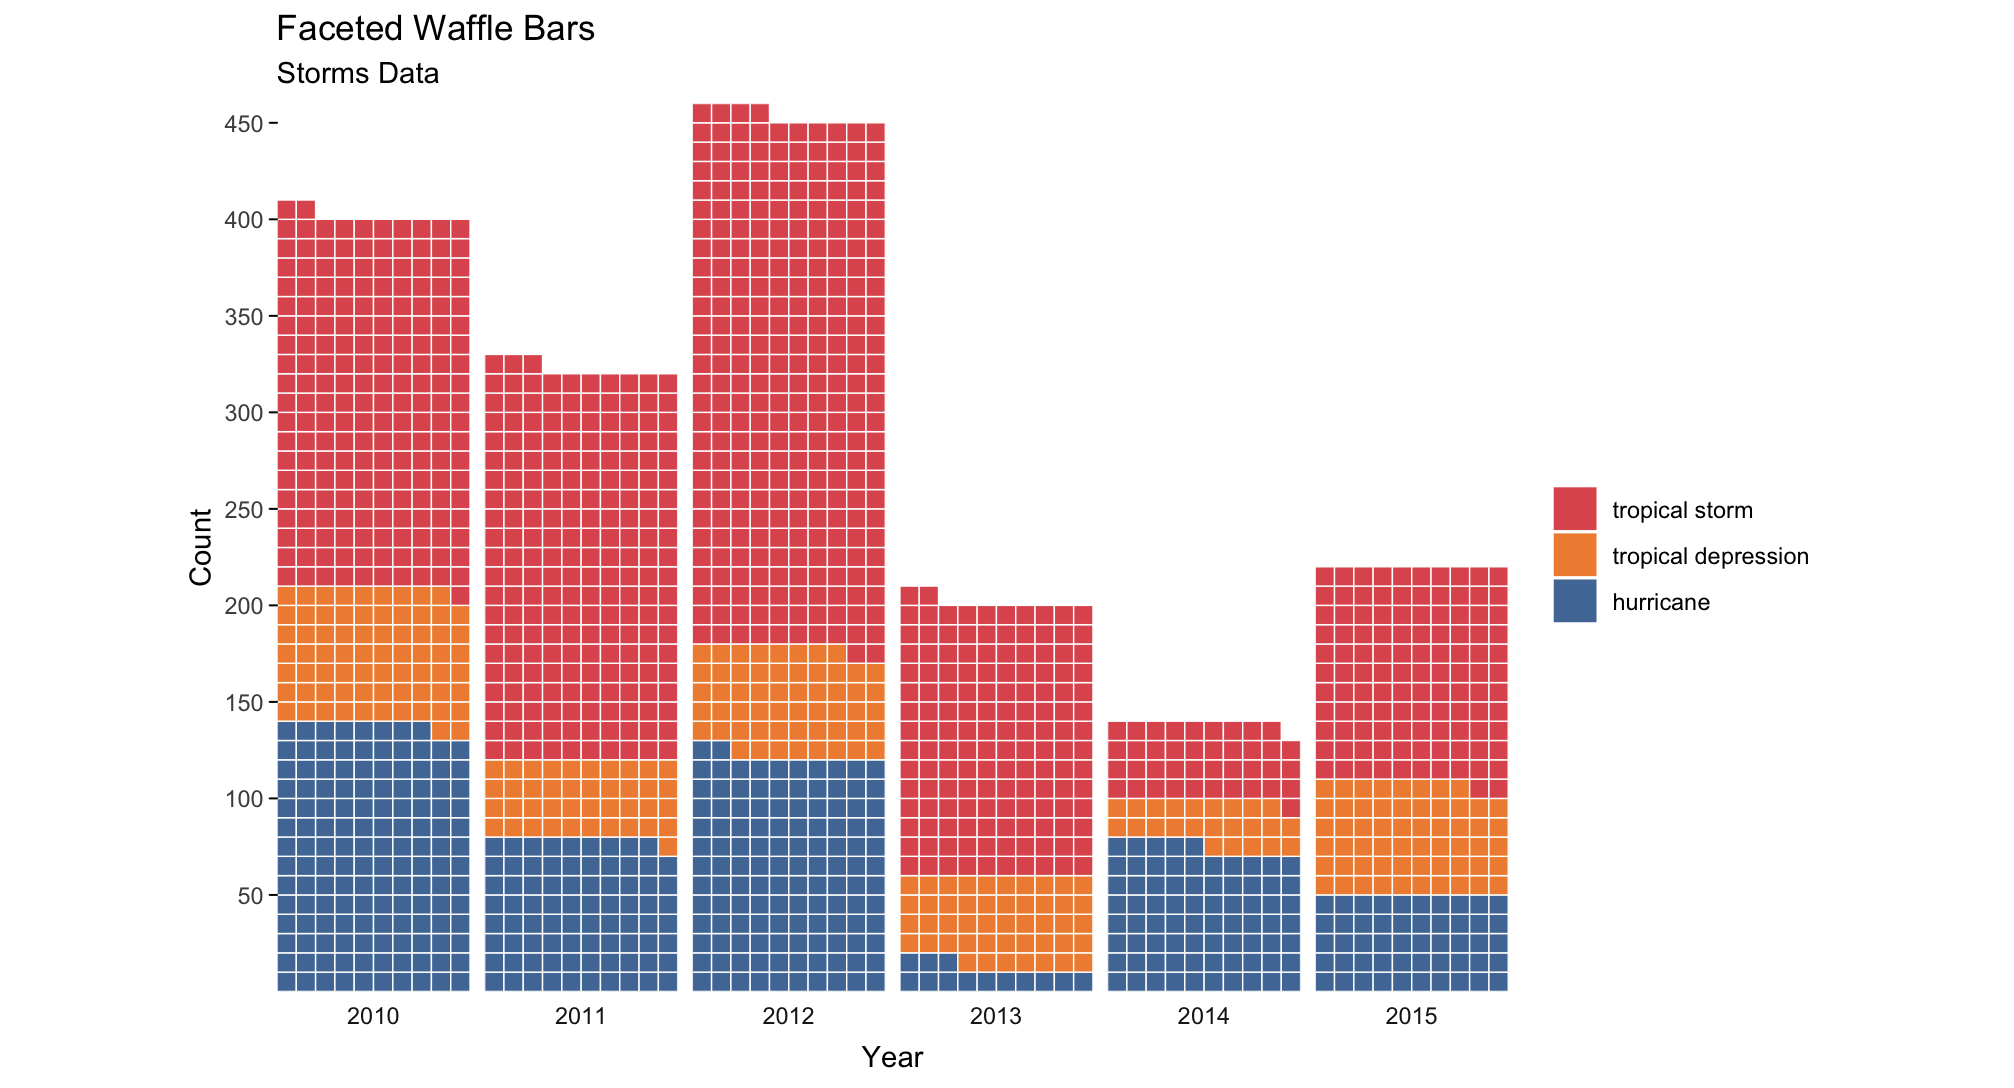
| storms %>% | |
| filter(year >= 2010) %>% | |
| count(year, status) -> storm_df | |
| ggplot(storm_df, aes(fill=status, values=n)) + | |
| geom_waffle(color = "white", size=.25, n_rows = 10, flip = T, show.legend = T) + | |
| facet_wrap(~year, nrow=1, strip.position = "bottom") + | |
| scale_x_discrete(expand=c(0,0)) + | |
| scale_y_continuous(breaks = function(x) seq(5, max(x), by = 5), | |
| labels = function(x) x * 10, # make this multiplyer the same as n_rows | |
| expand = c(0,0)) + | |
| ggthemes::scale_fill_tableau(name=NULL) + | |
| coord_equal() + | |
| labs( | |
| title = "Faceted Waffle Bars", | |
| subtitle = "Storms Data", | |
| x = "Year", | |
| y = "Count" | |
| ) + | |
| theme_minimal() + | |
| theme(panel.grid = element_blank(), | |
| axis.ticks.y = element_line()) + | |
| guides(fill = guide_legend(reverse = T)) | |
Author
PaulC91
commented
May 6, 2019
Sign up for free
to join this conversation on GitHub.
Already have an account?
Sign in to comment