Last active
September 23, 2023 06:47
-
-
Save Rafael09ED/61568afa8a2308b53917915ee37acfb2 to your computer and use it in GitHub Desktop.
This file contains hidden or bidirectional Unicode text that may be interpreted or compiled differently than what appears below. To review, open the file in an editor that reveals hidden Unicode characters.
Learn more about bidirectional Unicode characters
| %pip install scipy matplotlib pandas | |
| import numpy as np | |
| import datetime | |
| from matplotlib import pyplot as plt | |
| from shapely.geometry import LineString | |
| import matplotlib.dates as mdates | |
| import matplotlib | |
| from datetime import date | |
| from dateutil.relativedelta import relativedelta | |
| class MoneyModifier: | |
| def __init__(self, title, cost, frequency, tags, startDate, endDate): | |
| self.title = title | |
| self.cost = cost | |
| self.frequency = frequency #in Delta Time | |
| self.tags = tags #String Array | |
| self.startDate = startDate | |
| self.endDate = endDate | |
| def willDisplayTag(modifierTags, graphTags): | |
| hasTag = len(modifierTags) <= 0 | |
| for i in graphTags: # this can be optomized by filtering tags earlier inside simulate | |
| for j in modifierTags: | |
| if j == i: | |
| hasTag = True | |
| break | |
| if hasTag: | |
| break | |
| if not hasTag: | |
| return 0 | |
| return 1 | |
| class MoneyOverTimeCalculator: | |
| def __init__(self): | |
| self.modifiers = [] | |
| def addModifiers(self, modifiers): | |
| [self.addModifier(i) for i in modifiers] | |
| def addModifier(self, modifier): | |
| self.modifiers.append(modifier) | |
| def getModifiersWithTags(self, tagsToFilterFor): | |
| result = [] | |
| for modifier in self.modifiers: | |
| hasTag = True; | |
| for j in modifier.tags: | |
| if not j in tagsToFilterFor: | |
| hasTag = False | |
| break; | |
| if not hasTag: | |
| continue | |
| result.append(modifier) | |
| return result | |
| def simulate(self, startingDate, endingDate, timeDelta, tags): # returns array of monet per tick | |
| simulationOverTime = [] | |
| simulationTime = startingDate | |
| modifiers = self.getModifiersWithTags(tags) | |
| #print(tags, list(map(lambda i: i.title, modifiers))) | |
| while simulationTime < endingDate: | |
| tickAmount = 0 if len(simulationOverTime) <= 0 else simulationOverTime[-1] | |
| for i in modifiers: | |
| for _ in range(self.timesToBeAdded(simulationTime, simulationTime + timeDelta, i)): | |
| tickAmount += i.cost | |
| simulationOverTime.append(tickAmount) | |
| simulationTime = simulationTime + timeDelta | |
| return simulationOverTime; | |
| def timesToBeAdded(self, tickStart, tickEnd, modifier): | |
| if modifier.frequency is None: | |
| return 1 if tickStart <= modifier.startDate < tickEnd else 0 | |
| count = 0 | |
| modifierSimTime = modifier.startDate | |
| while modifierSimTime < tickStart: | |
| modifierSimTime = modifierSimTime + modifier.frequency | |
| while modifierSimTime < min (tickEnd, modifier.endDate): | |
| count += 1 | |
| modifierSimTime = modifierSimTime + modifier.frequency | |
| return count | |
| def drange(start, stop, step): | |
| r = start | |
| while r < stop: | |
| yield r | |
| r += step | |
| class MoneyOverTimeGraph: | |
| def __init__(self, startDate, endDate, calculator, showDetails=False): | |
| self.calculator = calculator | |
| self.startDate = startDate | |
| self.endDate = endDate | |
| self.showDetails = showDetails | |
| def buildDetailedTitle(self, title, graphTags): | |
| listOfTags = list(dict.fromkeys(map(lambda m: m.title, filter(lambda modifier: willDisplayTag(modifier.tags, graphTags), self.calculator.modifiers)))) | |
| baseTagsToRemove = list(map(lambda fm: fm.title, filter(lambda m: len(m.tags) == 0, calculator.modifiers))) | |
| tags = ', '.join([x for x in listOfTags if (x not in baseTagsToRemove)]) | |
| return title + f" ({tags})" if len(tags) > 0 else title | |
| def getSims(self, tagSets, timeDelta): | |
| sims = {} | |
| for title in tagSets: | |
| sims[self.buildDetailedTitle(title, tagSets[title]) if self.showDetails else title] = self.calculator.simulate(self.startDate, self.endDate, timeDelta, tagSets[title]) | |
| return sims | |
| def addSimToPlot(self, plt, x_axis, title, simValues): | |
| plt.plot(x_axis, simValues, label=title) | |
| # tagSets is dict:array => { "title1":["Salary", "Car"], "title2":["Rent, Car"], "title3":["Car"]] | |
| def graph(self, tagSets, timeDelta): | |
| sims = self.getSims(tagSets, timeDelta) | |
| plt.title("Cash on Hand Possibility Tree") | |
| plt.ylabel("Cash ($)") | |
| x_axis = list(drange(self.startDate, self.endDate, timeDelta)) | |
| for title in sims: | |
| self.addSimToPlot(plt, x_axis, title, sims[title]) | |
| locator = mdates.MonthLocator() | |
| fmt = formatter = mdates.ConciseDateFormatter(locator) | |
| plt.gca().yaxis.grid(True) | |
| X = plt.gca().xaxis | |
| X.set_major_locator(locator) | |
| X.set_major_formatter(fmt) | |
| plt.legend(loc="upper left") | |
| plt.show() | |
| matplotlib.rcParams['figure.figsize'] = [10, 5] | |
| # Script | |
| SEMI_MONTHLY_PAYCHECK=3000 | |
| SUBSCRIPTIONS=-(12+15+10+80) #phone | |
| calculator = MoneyOverTimeCalculator() | |
| quit_date = date(2023, 10, 1) | |
| new_job_date = date(2024, 6, 1) | |
| simStart = quit_date - relativedelta(weeks=+5) | |
| simEnd = new_job_date + relativedelta(weeks=+5) | |
| calculator.addModifiers([ | |
| MoneyModifier("Cash", 10000, None, [], simStart, None), | |
| MoneyModifier("Car Taxes", -536, relativedelta(years=+1), [], date(2022, 7, 1), simEnd), | |
| MoneyModifier("Car Insurance", -140, relativedelta(months=+1), [], date(2023, 7, 29), simEnd), | |
| MoneyModifier("Health Care", -222, relativedelta(months=+1), [], quit_date, simEnd), | |
| MoneyModifier("Bills / Subscriptions", SUBSCRIPTIONS, relativedelta(months=+1), [], simStart, simEnd), | |
| # Trailer | |
| MoneyModifier("Gas", -40, relativedelta(weeks=+2), [], simStart, simEnd), | |
| # Modifiers | |
| MoneyModifier("Tutoring", 60*10*.66, relativedelta(weeks=+1), ["extraWork"], quit_date, new_job_date - relativedelta(weeks=+1.5)), | |
| MoneyModifier("New Job Salary", SEMI_MONTHLY_PAYCHECK, relativedelta(weeks=+2), ["work"], new_job_date, simEnd), | |
| # Normal Spending | |
| MoneyModifier("Eating Out", -16*4*3, relativedelta(weeks=+1), ["casual"], simStart, simEnd), | |
| MoneyModifier("Excursion", -120, relativedelta(months=+1), [], simStart, simEnd), | |
| # Worst Case | |
| MoneyModifier("Massive Injury", -9000, None, ["worst"], quit_date, None), | |
| ]) | |
| show_details=False | |
| grapher = MoneyOverTimeGraph(simStart, simEnd, calculator, showDetails=show_details) | |
| # │├└ | |
| tagsToPrint = { | |
| f"Base{': ' + ', '.join(map(lambda m: m.title, filter(lambda m: len(m.tags) == 0, calculator.modifiers))) if show_details else ''}" : [], | |
| f"├ New Job In Spring" : ["work"], | |
| f"│ └ Tutoring" : ["work", "extraWork"], | |
| f"├ Casual" : ["casual"], | |
| f"│ └ Tutoring" : ["work", "extraWork", "casual"], | |
| f"└ Worst Case" : ["worst", "casual"], | |
| } | |
| grapher.graph(tagsToPrint, relativedelta(days=+1)) |
Author
Author
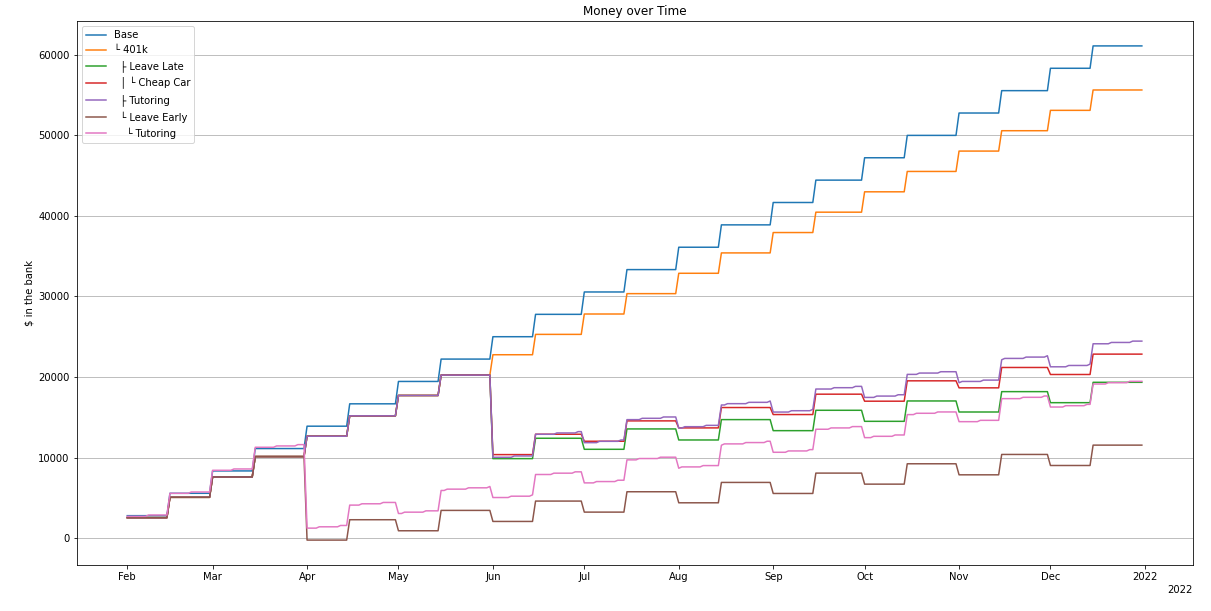
Update Example:

Sign up for free
to join this conversation on GitHub.
Already have an account?
Sign in to comment
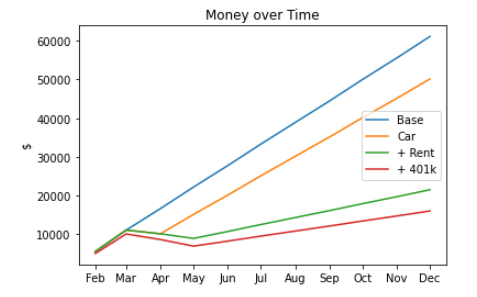
Produces graphs like:
Performance is probably around O(nopq)