Last active
November 14, 2019 06:20
-
-
Save Ryo-N7/acd8751f77f0008856be2630d424a730 to your computer and use it in GitHub Desktop.
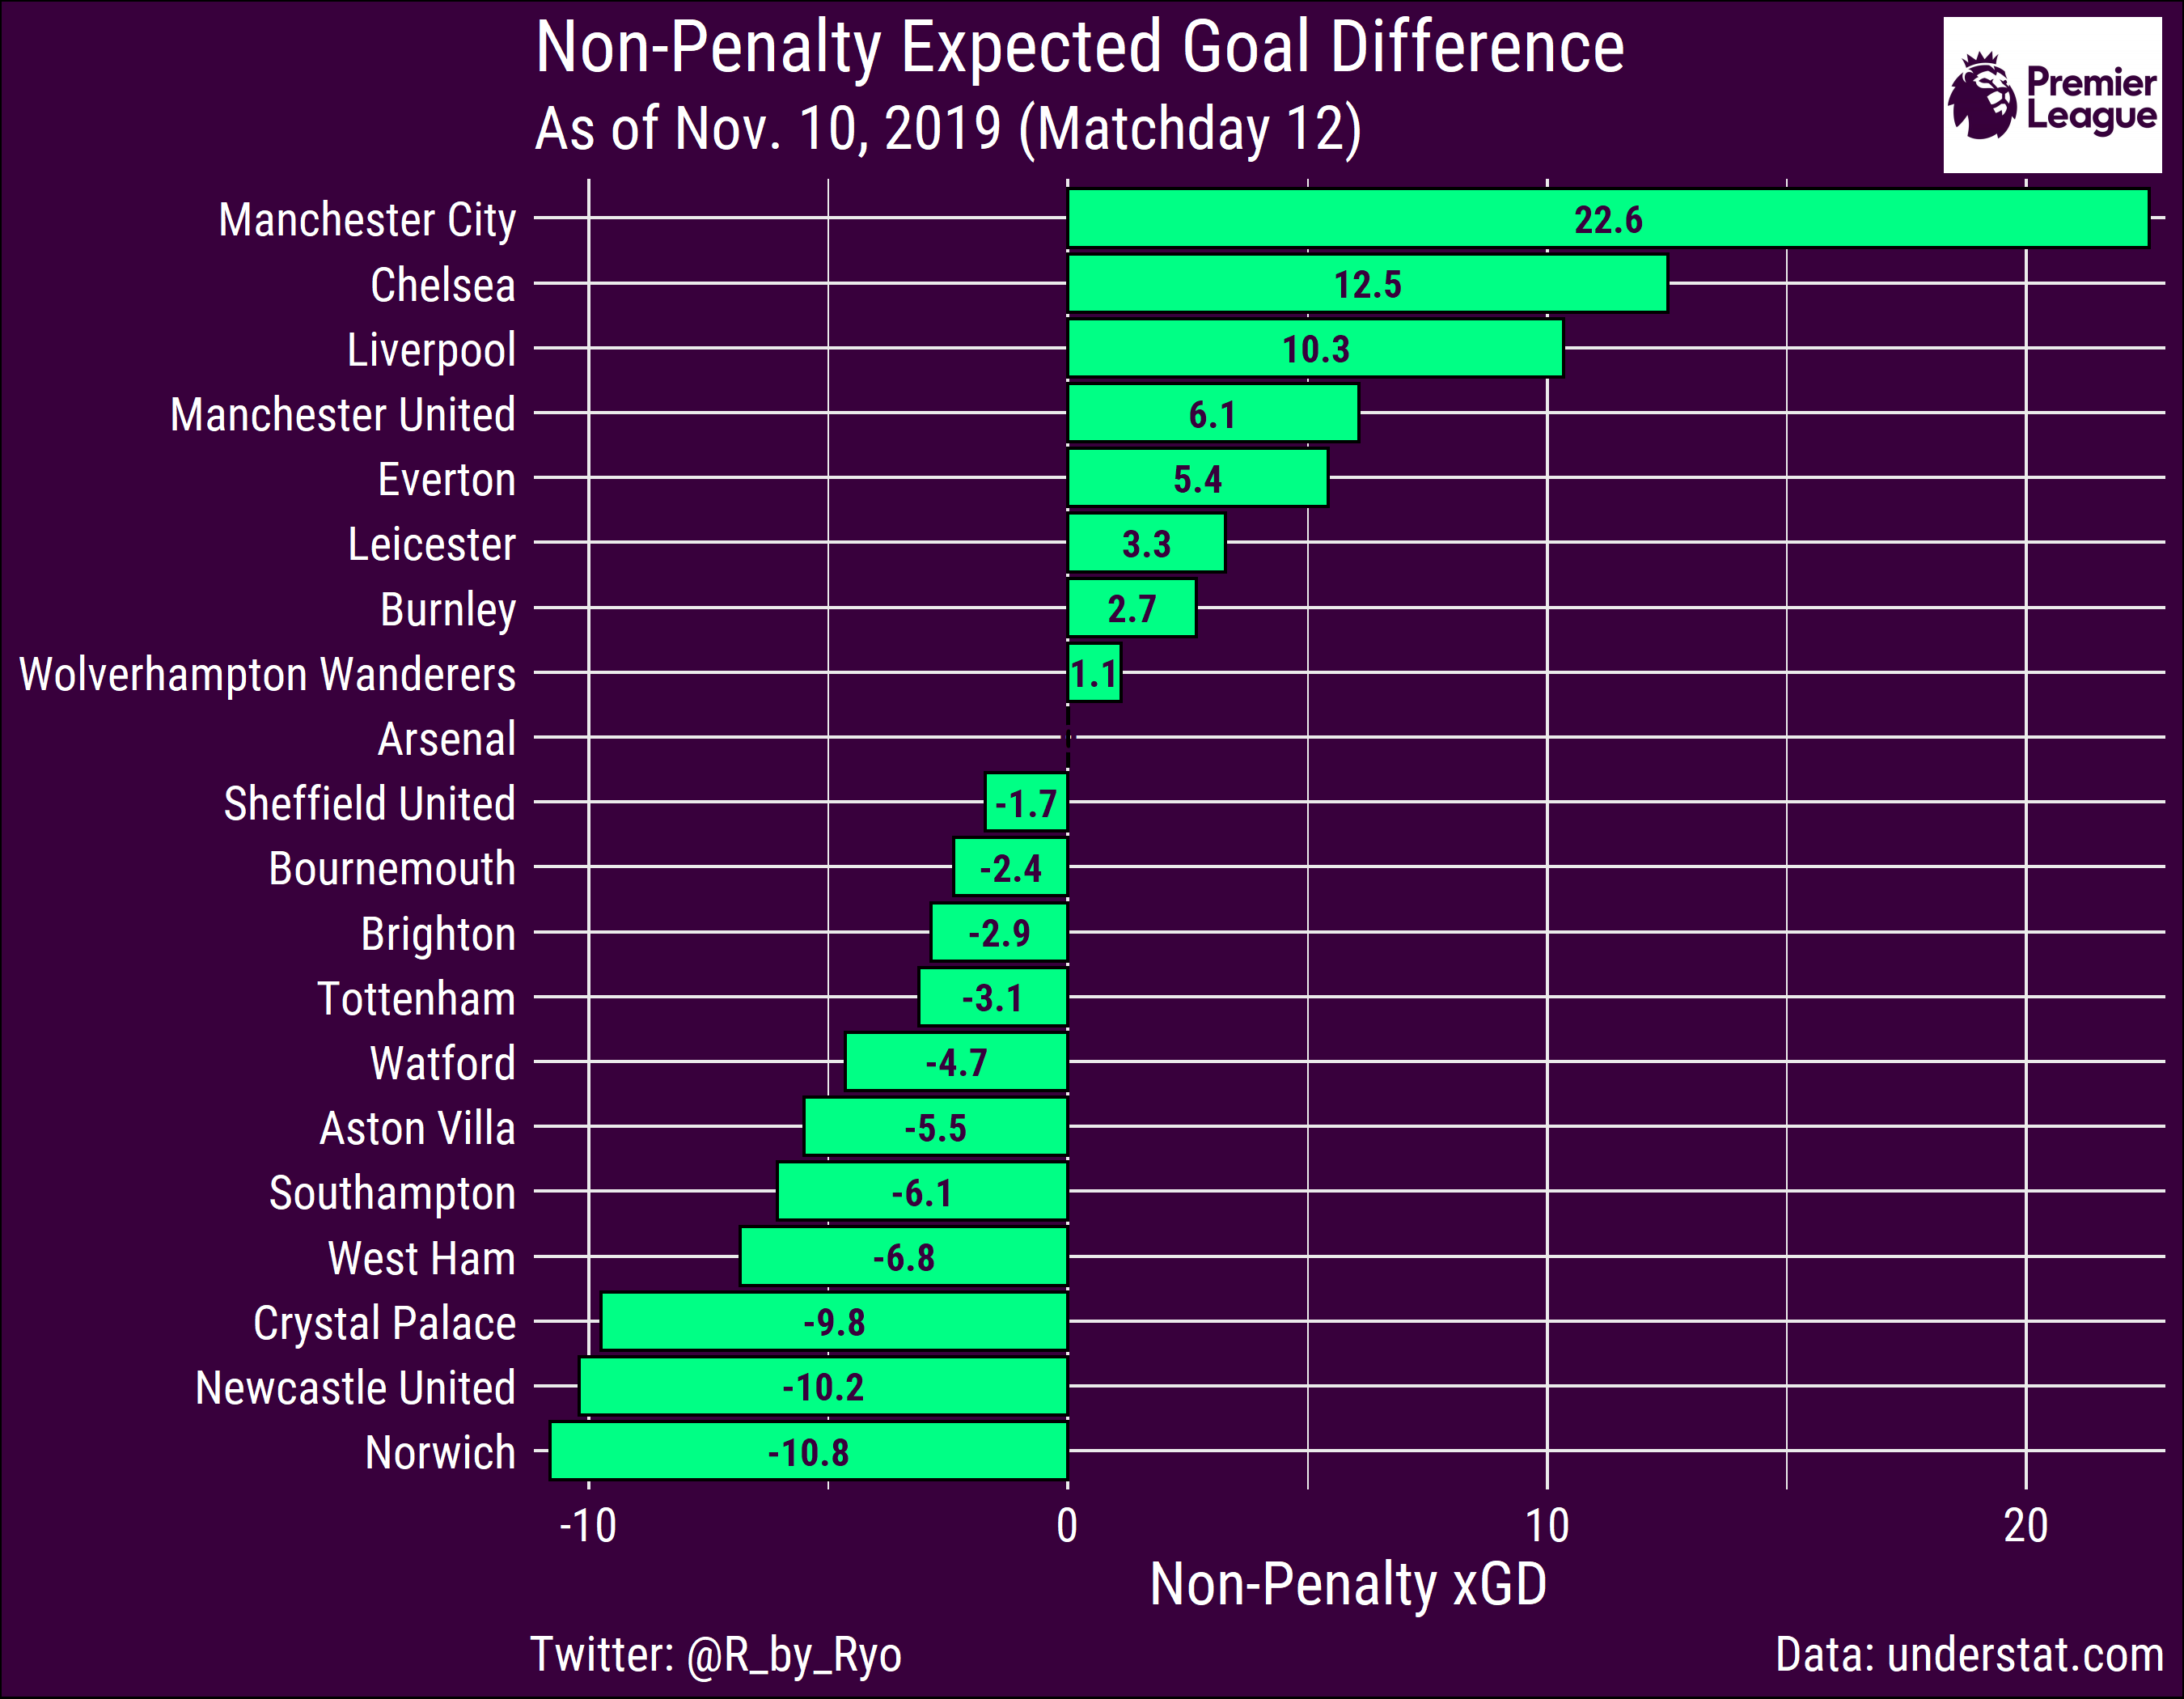
EPL Expected Goal Difference Plot (up to Nov. 10, 2019 // Matchday 12)
This file contains hidden or bidirectional Unicode text that may be interpreted or compiled differently than what appears below. To review, open the file in an editor that reveals hidden Unicode characters.
Learn more about bidirectional Unicode characters
| # Packages | |
| pacman::p_load(tidyverse, understatr, | |
| glue, extrafont, magick) | |
| loadfonts(quiet = TRUE) | |
| ## add_logo function from Thomas Mock | |
| add_logo <- function(plot_path, logo_path, logo_position, logo_scale = 10){ | |
| # Requires magick R Package https://github.com/ropensci/magick | |
| # Useful error message for logo position | |
| if (!logo_position %in% c("top right", "top left", "bottom right", "bottom left")) { | |
| stop("Error Message: Uh oh! Logo Position not recognized\n Try: logo_positon = 'top left', 'top right', 'bottom left', or 'bottom right'") | |
| } | |
| # read in raw images | |
| plot <- magick::image_read(plot_path) | |
| logo_raw <- magick::image_read(logo_path) | |
| # get dimensions of plot for scaling | |
| plot_height <- magick::image_info(plot)$height | |
| plot_width <- magick::image_info(plot)$width | |
| # default scale to 1/10th width of plot | |
| # Can change with logo_scale | |
| logo <- magick::image_scale(logo_raw, as.character(plot_width/logo_scale)) | |
| # Get width of logo | |
| logo_width <- magick::image_info(logo)$width | |
| logo_height <- magick::image_info(logo)$height | |
| # Set position of logo | |
| # Position starts at 0,0 at top left | |
| # Using 0.01 for 1% - aesthetic padding | |
| if (logo_position == "top right") { | |
| x_pos = plot_width - logo_width - 0.01 * plot_width | |
| y_pos = 0.01 * plot_height | |
| } else if (logo_position == "top left") { | |
| x_pos = 0.01 * plot_width | |
| y_pos = 0.01 * plot_height | |
| } else if (logo_position == "bottom right") { | |
| x_pos = plot_width - logo_width - 0.01 * plot_width | |
| y_pos = plot_height - logo_height - 0.01 * plot_height | |
| } else if (logo_position == "bottom left") { | |
| x_pos = 0.01 * plot_width | |
| y_pos = plot_height - logo_height - 0.01 * plot_height | |
| } | |
| # Compose the actual overlay | |
| magick::image_composite(plot, logo, offset = paste0("+", x_pos, "+", y_pos)) | |
| } | |
| # Get data from understat | |
| premierleague2019 <- understatr::get_league_teams_stats("EPL", 2019) | |
| # tidy data and plot | |
| ## set fig.height = 7, fig.width = 9 | |
| xGD_plot <- premierleague2019 %>% | |
| select(team_name, everything()) %>% | |
| group_by(team_name) %>% | |
| summarize(sum_npxG = sum(npxG), | |
| sum_npxGA = sum(npxGA)) %>% | |
| mutate(npxGD = sum_npxG - sum_npxGA, | |
| team_name = as_factor(team_name), | |
| team_name = fct_reorder(team_name, npxGD), | |
| half = npxGD / 2) %>% | |
| arrange(desc(npxGD)) %>% | |
| ggplot(aes(x = team_name, y = npxGD)) + | |
| geom_col(color = "black", fill = "#00ff85") + | |
| geom_text(aes(y = half, label = round(npxGD, digits = 1)), | |
| color = "#38003c", size = 4, fontface = "bold", | |
| family = "Roboto Condensed") + | |
| scale_y_continuous(expand = c(0.01, 0)) + | |
| labs(title = "Non-Penalty Expected Goal Difference", | |
| subtitle = "As of Nov. 10, 2019 (Matchday 12)", | |
| x = NULL, y = "Non-Penalty xGD", | |
| caption = glue("Twitter: @R_by_Ryo Data: understat.com")) + | |
| theme_minimal() + | |
| theme(text = element_text(family = "Roboto Condensed", | |
| color = "white"), | |
| title = element_text(size = 18), | |
| axis.text = element_text(color = "white", size = 14), | |
| plot.background = element_rect(fill = "#38003c")) + | |
| coord_flip() | |
| ## Noice! | |
| xGD_plot | |
| # save initial plot | |
| ## replace `filename` with what/whereever you want to save it | |
| ggsave(plot = xGD_plot, | |
| filename = here::here("Premier League 2019-2020/output/xGD_plot.png"), | |
| height = 7, width = 9) | |
| # add logo via {magick} | |
| xGD_plot_logo <- add_logo( | |
| plot_path = here::here("Premier League 2019-2020/output/xGD_plot.png"), | |
| logo_path = "https://static.dezeen.com/uploads/2016/08/designstudiopremier-league-rebrand-relaunch-logo-design-barclays-football_dezeen_slideshow-a-852x609.jpg", | |
| logo_position = "top right", | |
| logo_scale = 10) | |
| ## Toit! | |
| xGD_plot_logo | |
| # save final plot | |
| ## replace `filename` with what/whereever you want to save it | |
| image_write(image = xGD_plot_logo, | |
| path = here::here("Premier League 2019-2020/output/xGD_plot_logo.png")) | |
Author
Ryo-N7
commented
Nov 14, 2019
Sign up for free
to join this conversation on GitHub.
Already have an account?
Sign in to comment