Created
October 9, 2019 14:44
-
-
Save Ryo-N7/bf83632c5063b301b9af739d0ecef820 to your computer and use it in GitHub Desktop.
Klopp's Managerial History v2
This file contains hidden or bidirectional Unicode text that may be interpreted or compiled differently than what appears below. To review, open the file in an editor that reveals hidden Unicode characters.
Learn more about bidirectional Unicode characters
| ```{r message=FALSE} | |
| pacman::p_load(tidyverse, scales, lubridate, ggrepel, | |
| glue, extrafont, grid, gridExtra, ggtext) | |
| loadfonts(quiet = TRUE) | |
| ``` | |
| ```{r} | |
| lfc_elo_raw <- read_csv("http://api.clubelo.com/liverpool") | |
| dortmund_elo_raw <- read_csv("http://api.clubelo.com/Dortmund") | |
| mainz_elo_raw <- read_csv("http://api.clubelo.com/Mainz") | |
| mainz_elo_clean <- mainz_elo_raw %>% | |
| filter(between(From, as.Date("2001-02-28"), as.Date("2008-05-19"))) | |
| dortmund_elo_clean <- dortmund_elo_raw %>% | |
| filter(between(From, as.Date("2008-08-15"), as.Date("2015-05-24"))) | |
| lfc_elo_clean <- lfc_elo_raw %>% | |
| filter(From >= as.Date("2015-10-05")) | |
| klopp <- lfc_elo_clean %>% | |
| bind_rows(dortmund_elo_clean, mainz_elo_clean) %>% | |
| mutate(Club = as_factor(Club)) | |
| ``` | |
| ```{r} | |
| # Klopp | |
| # Mainz: 2003-2004 Promotion to Bundesliga 2004-05-24 | |
| # Dortmund: 2010-2011 2011-05-14 | |
| # 2011-2012 Bundesliga champions 2012-05-05 | |
| # 2013 Champions League Final 2013-05-25 | |
| # LFC: October 2015 2015-10-08 | |
| # Europa League Final 2016-05-18 | |
| # 2018 Champions League Final 2018-05-26 | |
| annotations_df <- data.frame( | |
| date = as.Date(c("2004-05-24", "2011-05-15", "2012-05-05", | |
| "2013-05-25", "2016-05-18", "2018-05-26", | |
| "2019-06-01")), | |
| lab_pos = as.Date(c("2004-05-24", "2009-09-01", "2009-09-01", | |
| "2009-11-01", "2016-01-01", "2015-08-01", | |
| "2017-01-01")), | |
| y = c(1700, 1920, 1970, 2030, 1950, 2020, 2080), | |
| text = c("Promotion to Bundesliga ('03-'04)", | |
| "Bundesliga Champions ('10-'11)", | |
| "Bundesliga Champions ('11-'12)", | |
| "2013 Champions League Final", | |
| "2016 Europa League Final", | |
| "2018 Champions League Final", | |
| "2019 Champions League Final") | |
| ) | |
| #library(teamcolors) | |
| cols <- c("Liverpool" = "#D00027", "Dortmund" = "#FFE500", "Mainz" = "#C4122E") | |
| ``` | |
| ```{r klopp chart, fig.height = 8, fig.width=11} | |
| klopp %>% | |
| ggplot() + | |
| geom_line(aes(From, y = Elo, color = Club), | |
| size = 1.5) + | |
| scale_x_date(breaks = pretty_breaks(10)) + | |
| scale_y_continuous(limits = c(1430, 2200), position = "right") + | |
| scale_color_manual(values = cols, guide = FALSE) + | |
| labs(x = NULL, y = "Club Elo Rating", | |
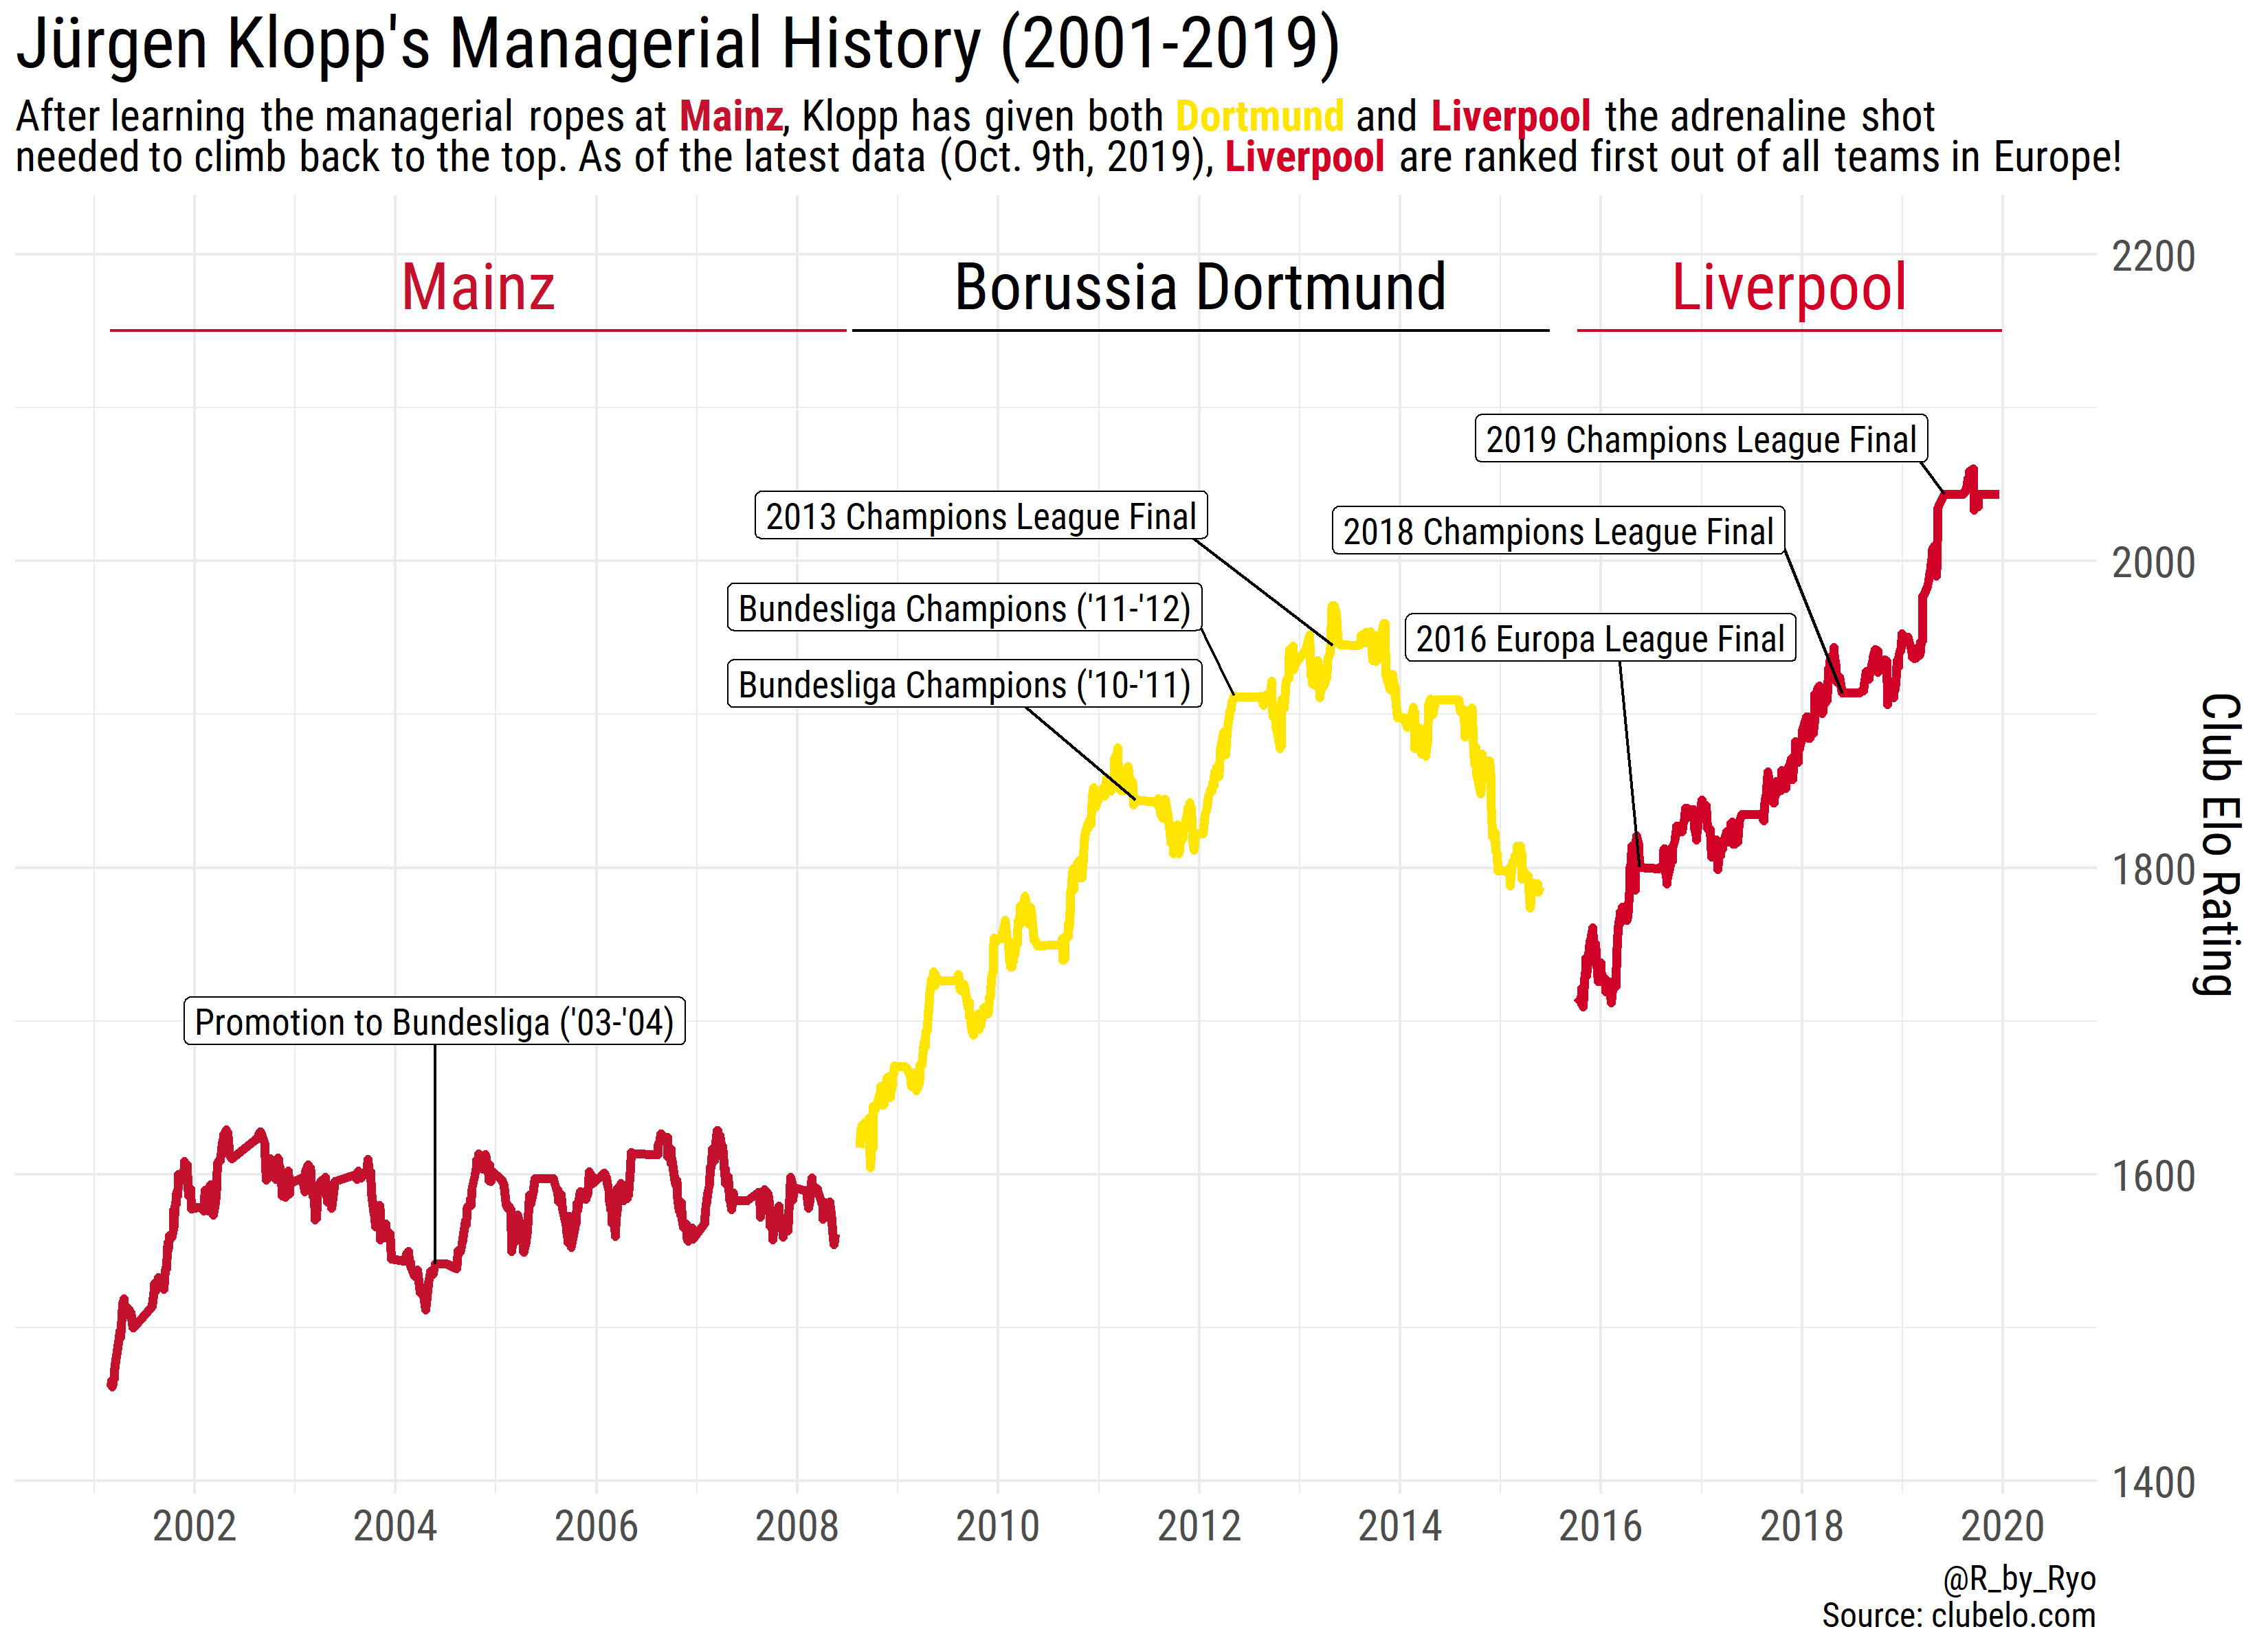
| title = "Jürgen Klopp's Managerial History (2001-2019)", | |
| subtitle = "After learning the managerial ropes at <b style='color:#C4122E'>Mainz</b>, Klopp has given both <b style='color:#FFE500'>Dortmund</b> and <b style='color:#D00027'>Liverpool</b> the adrenaline shot <br>needed to climb back to the top. As of the latest data (Oct. 9th, 2019), <b style='color:#D00027'>Liverpool</b> are ranked first out of all teams in Europe!", | |
| caption = glue(" | |
| @R_by_Ryo | |
| Source: clubelo.com")) + | |
| theme_minimal() + | |
| theme(text = element_text(family = "Roboto Condensed"), | |
| plot.title = element_text(size = 25), | |
| #plot.subtitle = element_text(size = 15), | |
| plot.subtitle = element_markdown(size = 15), | |
| plot.caption = element_text(size = 12), | |
| axis.title = element_text(size = 18), | |
| axis.text = element_text(size = 15)) + | |
| # Connecting segments: | |
| annotate(geom = "segment", | |
| x = as.Date("2004-05-24"), xend = as.Date("2004-05-24"), | |
| y = 1541.472, yend = 1700) + | |
| annotate(geom = "segment", | |
| x = as.Date("2011-05-14"), xend = as.Date("2010-01-01"), | |
| y = 1844.078, yend = 1920) + | |
| annotate(geom = "segment", | |
| x = as.Date("2012-05-05"), xend = as.Date("2011-12-01"), | |
| y = 1912.054, yend = 1970) + | |
| ## CL Final | |
| annotate(geom = "segment", | |
| x = as.Date("2013-05-01"), xend = as.Date("2011-11-01"), | |
| y = 1945.104, yend = 2020) + | |
| annotate(geom = "segment", | |
| x = as.Date("2016-05-18"), xend = as.Date("2016-03-01"), | |
| y = 1800.110, yend = 1950) + | |
| annotate(geom = "segment", | |
| x = as.Date("2018-05-26"), xend = as.Date("2017-10-01"), | |
| y = 1913.713, yend = 2020) + | |
| annotate(geom = "segment", | |
| x = as.Date("2019-06-01"), xend = as.Date("2019-01-01"), | |
| y = 2043.473, yend = 2080) + | |
| # achievements text: | |
| geom_label(data = annotations_df, | |
| aes(x = lab_pos, y = y, label = text), | |
| family = "Roboto Condensed", size = 4.5) + | |
| # Team names + bars: | |
| ## Mainz | |
| annotate(geom = "segment", | |
| x = as.Date("2001-02-28"), xend = as.Date("2008-06-30"), | |
| y = 2150, yend = 2150, color = "#C4122E") + | |
| annotate(geom = "text", | |
| x = as.Date("2004-10-29"), y = 2180, | |
| label = "Mainz", family = "Roboto Condensed", | |
| color = "#C4122E", size = 8) + | |
| ## Dortmund | |
| annotate(geom = "segment", | |
| x = as.Date("2008-07-18"), xend = as.Date("2015-06-30"), | |
| y = 2150, yend = 2150) + | |
| annotate(geom = "text", | |
| x = as.Date("2012-01-08"), y = 2180, | |
| label = "Borussia Dortmund", family = "Roboto Condensed", | |
| size = 8) + | |
| ## Liverpool | |
| annotate(geom = "segment", | |
| x = as.Date("2015-10-08"), xend = as.Date("2019-12-30"), | |
| y = 2150, yend = 2150, color = "#D00027") + | |
| annotate(geom = "text", | |
| x = as.Date("2017-11-18"), y = 2180, | |
| label = "Liverpool", family = "Roboto Condensed", | |
| color = "#D00027", size = 8) | |
| ``` | |
| ```{r} | |
| ggsave(filename = here::here("Premier League 2018-2019/output/klopp_manager_history2.png"), | |
| height = 8, width = 11) | |
| ``` |
Author
Ryo-N7
commented
Oct 9, 2019
Sign up for free
to join this conversation on GitHub.
Already have an account?
Sign in to comment