Last active
September 1, 2019 14:47
-
-
Save Ryo-N7/f45d9bdca30e4a25151050dda9f764a9 to your computer and use it in GitHub Desktop.
Champions League + Europa League Elo ratings per team/group
This file contains hidden or bidirectional Unicode text that may be interpreted or compiled differently than what appears below. To review, open the file in an editor that reveals hidden Unicode characters.
Learn more about bidirectional Unicode characters
| ```{r setup, include=FALSE} | |
| knitr::opts_chunk$set(echo = TRUE, message = FALSE, warning = FALSE) | |
| ``` | |
| # Packages | |
| ```{r} | |
| pacman::p_load(tidyverse, scales, lubridate, | |
| ggrepel, glue, extrafont, | |
| polite, rvest) | |
| loadfonts(quiet = TRUE) | |
| ``` | |
| # Elo Ratings 8.31.19 | |
| ```{r} | |
| ## Elo Ratings from 8.31.19 | |
| elo_ratings_raw <- read.csv("http://api.clubelo.com/2019-08-31") | |
| ``` | |
| # Europa League | |
| ## webscrape | |
| ```{r} | |
| url <- "https://en.wikipedia.org/wiki/2019%E2%80%9320_UEFA_Europa_League_group_stage" | |
| session <- bow(url) | |
| EL_teams <- scrape(session) %>% | |
| html_nodes(".wikitable th+ td") %>% | |
| html_text() %>% | |
| as_tibble() %>% | |
| rename(team_name = value) %>% | |
| mutate(team_name = team_name %>% trimws()) | |
| country_league <- scrape(session) %>% | |
| html_nodes("th+ td .thumbborder") %>% | |
| html_attr("alt") %>% | |
| as_tibble() %>% | |
| rename(country_league = value) | |
| EL_teams_clean <- EL_teams %>% | |
| bind_cols(country_league) | |
| ``` | |
| ## clean | |
| ```{r} | |
| EL_teams_df <- EL_teams_clean %>% | |
| mutate(team_name = team_name %>% | |
| iconv(from = "UTF-8", to = "ASCII//TRANSLIT"), | |
| elo_name = case_when( | |
| team_name == "Qarabag" ~ "Karabakh Agdam", | |
| team_name == "F91 Dudelange" ~ "Dudelange", | |
| team_name == "Copenhagen" ~ "FC Kobenhavn", | |
| team_name == "Malmo FF" ~ "Malmoe", | |
| team_name == "Krasnodar" ~ "FC Krasnodar", | |
| team_name == "Sporting CP" ~ "Sporting", | |
| team_name == "PSV Eindhoven" ~ "PSV", | |
| team_name == "Eintracht Frankfurt" ~ "Frankfurt", | |
| team_name == "Standard Liege" ~ "Standard", | |
| team_name == "Vitoria de Guimaraes" ~ "Guimaraes", | |
| team_name == "CSKA Moscow" ~ "CSKA Moskva", | |
| team_name == "Ludogorets Razgrad" ~ "Razgrad", | |
| team_name == "Ferencvaros" ~ "Ferencvaros", | |
| team_name == "VfL Wolfsburg" ~ "Wolfsburg", | |
| team_name == "KAA Gent" ~ "Gent", | |
| team_name == "Saint-Etienne" ~ "Saint-Etienne", | |
| team_name == "Oleksandriya" ~ "Olexandriya", | |
| team_name == "Borussia Monchengladbach" ~ "Gladbach", | |
| team_name == "Istanbul Basaksehir" ~ "Bueyueksehir", | |
| team_name == "Wolfsberger AC" ~ "Wolfsberg", | |
| team_name == "Beşiktas" ~ "Besiktas", | |
| team_name == "Wolverhampton Wanderers" ~ "Wolves", | |
| team_name == "Manchester United" ~ "Man United", | |
| team_name == "Astana" ~ "FK Astana", | |
| team_name == "AZ" ~ "Alkmaar", | |
| TRUE ~ team_name | |
| )) %>% | |
| ## join Club info to Elo data | |
| left_join(elo_ratings_raw, by = c("elo_name" = "Club")) %>% | |
| janitor::clean_names() %>% | |
| select(-level, -from, -to, -elo_name) %>% | |
| ## fill out group names per 4 rows | |
| mutate(group = rep(LETTERS[1:12], each = 4, length.out = 48) %>% | |
| as.factor()) %>% | |
| ## per group stats | |
| group_by(group) %>% | |
| mutate(avg_elo = mean(elo), | |
| med_elo = median(elo), | |
| max_elo = max(elo), | |
| min_elo = min(elo)) %>% | |
| ungroup() %>% | |
| ## manually change names | |
| ## manually spread out the labels | |
| mutate( | |
| team_name = case_when( | |
| team_name == "Wolverhampton Wanderers" ~ "Wolves", | |
| team_name == "PSV Eindhoven" ~ "PSV", | |
| team_name == "Borussia Monchengladbach" ~ "Gladbach", | |
| team_name == "Sporting CP" ~ "Sporting", | |
| team_name == "Vitoria de Guimaraes" ~ "Vitoria S.C.", | |
| TRUE ~ team_name), | |
| elo_2 = case_when( | |
| ## slightly nudge the Elo points so labels won't overlap | |
| ## this means the below 7 teams will appear on slightly different points total than reality... | |
| team_name == "CFR Cluj" ~ elo - 10, | |
| team_name == "Sporting" ~ elo + 10, | |
| team_name == "PSV" ~ elo - 10, | |
| team_name == "Braga" ~ elo + 10, | |
| team_name == "Besiktas" ~ elo - 10, | |
| team_name == "AZ" ~ elo + 10, | |
| team_name == "Partizan" ~ elo - 5, | |
| TRUE ~ elo), | |
| group = forcats::fct_reorder(group, med_elo)) | |
| ``` | |
| ## plot | |
| ```{r, fig.height = 7, fig.width=15} | |
| EL_teams_df %>% | |
| ggplot(aes(x = group, y = elo, group = group)) + | |
| geom_segment(aes(x = group, xend = group, | |
| y = max_elo, yend = min_elo, | |
| group = group), | |
| size = 2.25, color = "lightgrey") + | |
| geom_point(aes(y = med_elo, group = group), | |
| size = 4.5, color = "red") + | |
| geom_text(aes(y = elo_2, label = team_name), | |
| vjust = 0.5, | |
| size = 4.5, family = "Roboto Condensed", | |
| show.legend = FALSE) + | |
| geom_curve(aes(x = 12.8, xend = 12.1, | |
| y = 1675, yend = 1675), | |
| arrow = arrow(length = unit(0.07, "inch")), | |
| size = 0.5, color = "black", curvature = 0.35) + | |
| geom_text(x = 12.85, y = 1675, | |
| hjust = 0, color = "red", | |
| family = "Roboto Condensed", | |
| size = 4, | |
| label = glue::glue(" | |
| Median ELO | |
| (per group)")) + | |
| scale_x_discrete(expand = expand_scale(add = c(0.5, 1.75))) + | |
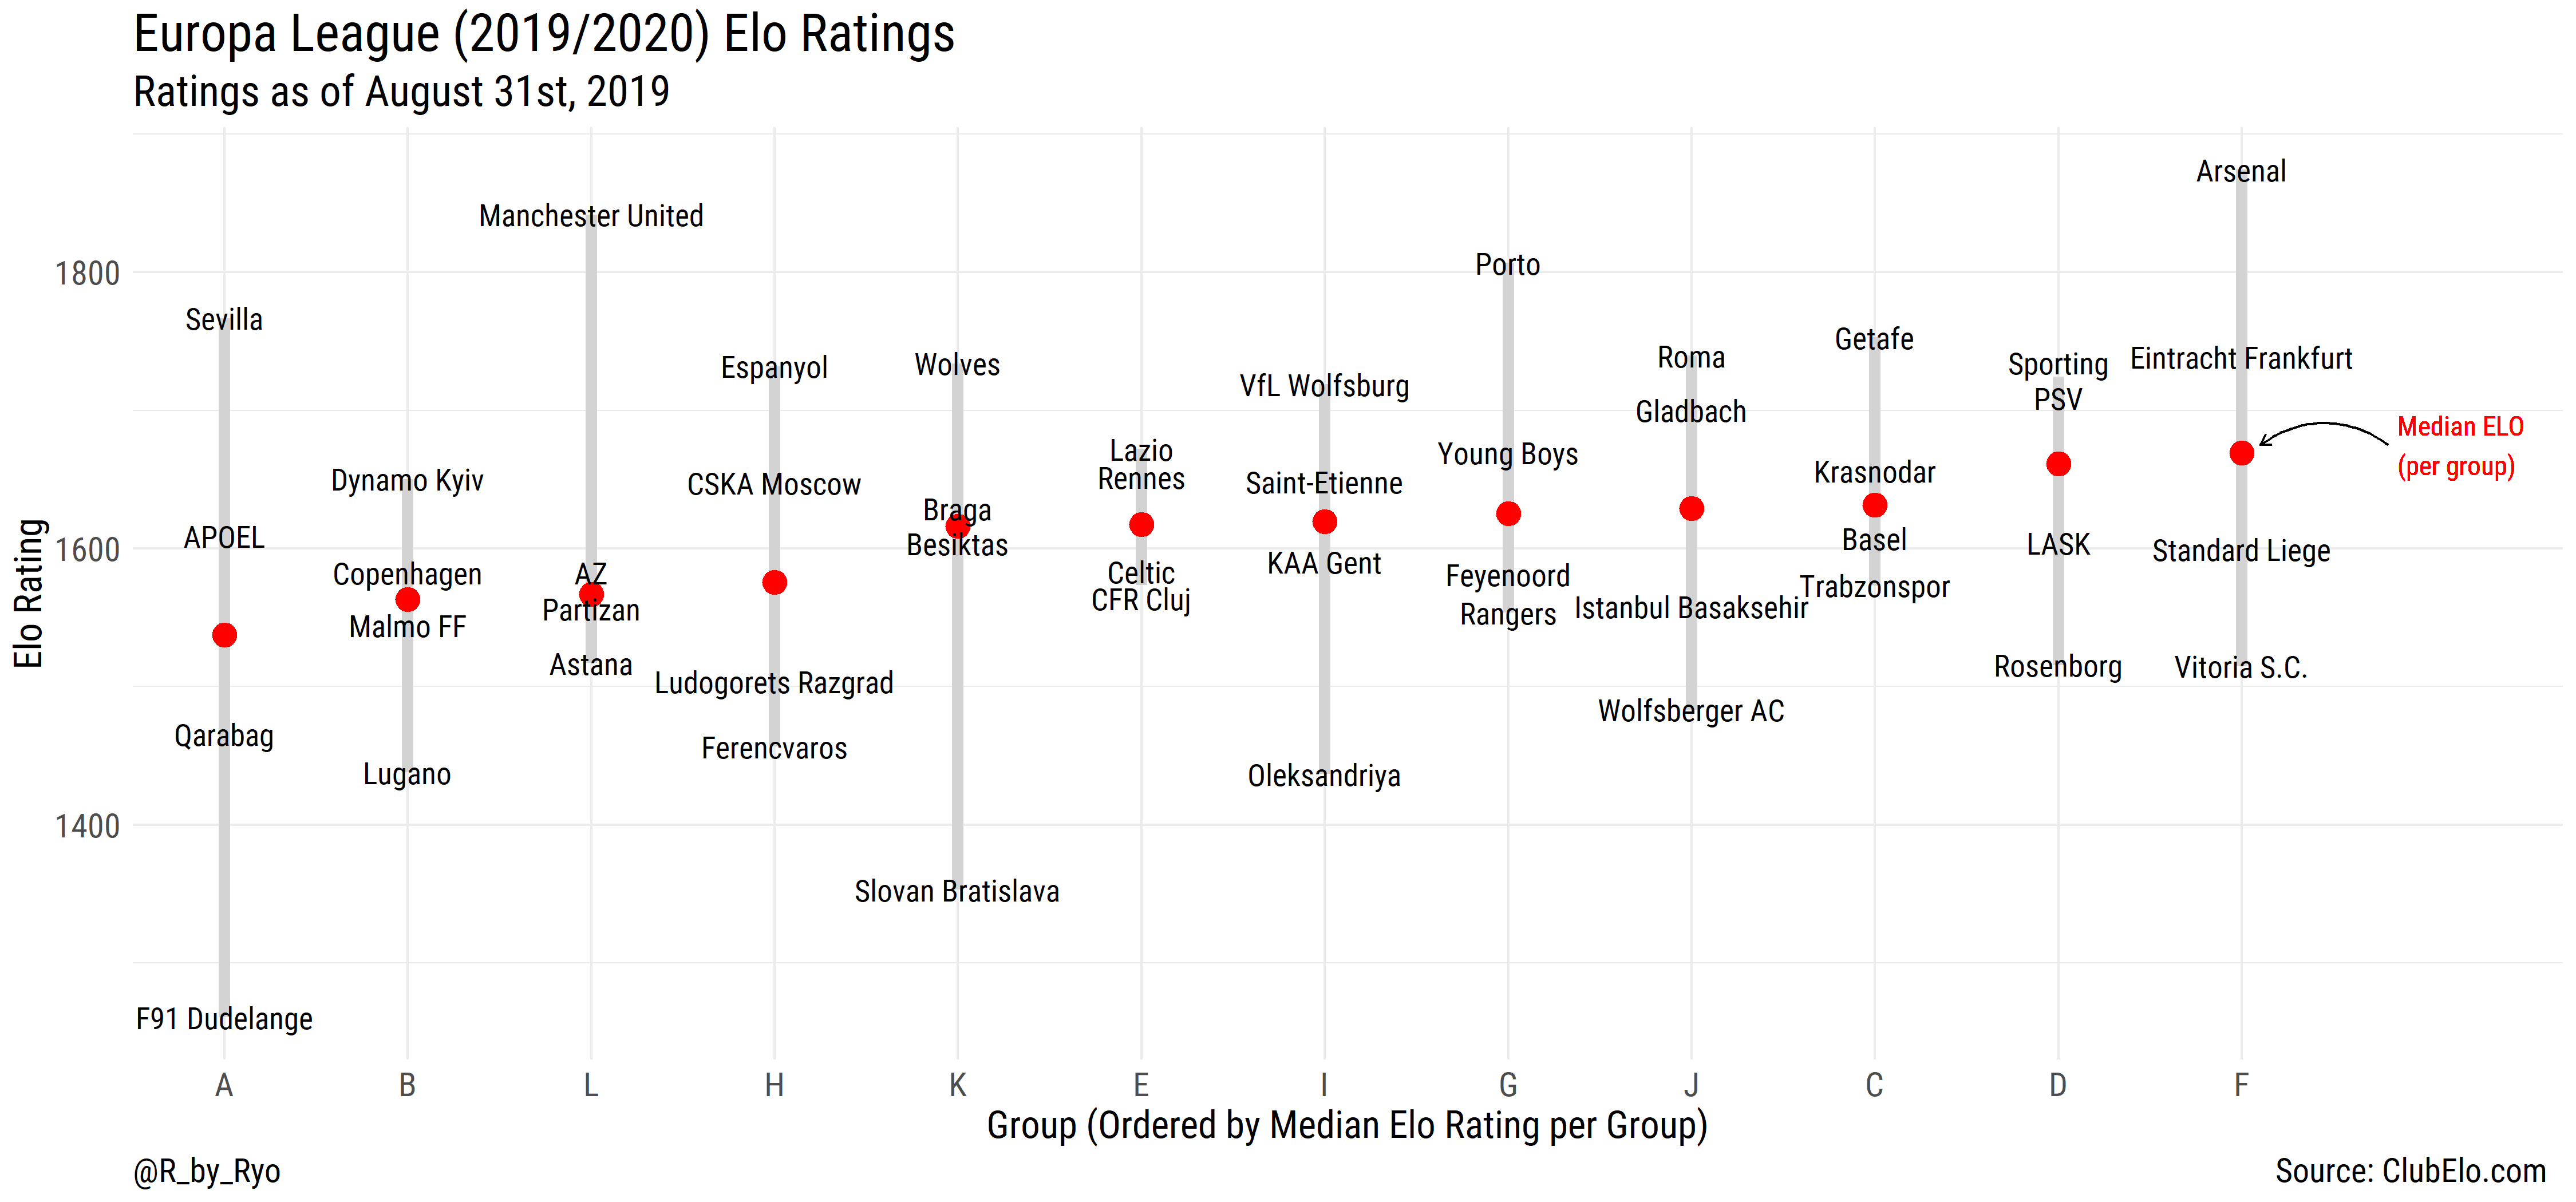
| labs(title = "Europa League (2019/2020) Elo Ratings", | |
| subtitle = "Ratings as of August 31st, 2019", | |
| x = "Group (Ordered by Median Elo Rating per Group)", y = "Elo Rating", | |
| caption = "@R_by_Ryo Source: ClubElo.com") + | |
| theme_minimal() + | |
| theme(text = element_text(family = "Roboto Condensed"), | |
| plot.title = element_text(size = 22), | |
| plot.subtitle = element_text(size = 18), | |
| plot.caption = element_text(size = 14, hjust = 0), | |
| axis.title = element_text(size = 16), | |
| axis.text = element_text(size = 14)) | |
| ``` | |
| ```{r} | |
| ggsave(filename = here::here( | |
| "Champions League & Europa League 2019-2020/outputs/euroleague_eloPlot.png"), | |
| width = 15, height = 7) | |
| ``` | |
| # Champions League | |
| ## webscrape | |
| ```{r} | |
| url2 <- "https://en.wikipedia.org/wiki/2019%E2%80%9320_UEFA_Champions_League_group_stage" | |
| session2 <- bow(url2) | |
| CL_teams <- scrape(session2) %>% | |
| html_nodes("h3+ .wikitable .flagicon+ a") %>% | |
| html_text() %>% | |
| as_tibble() %>% | |
| rename(team_name = value) %>% | |
| mutate(team_name = team_name %>% trimws()) | |
| country_leagueCL <- scrape(session2) %>% | |
| html_nodes("h3+ .wikitable .thumbborder") %>% | |
| html_attr("alt") %>% | |
| as_tibble() %>% | |
| rename(country_league = value) | |
| CL_teams_clean <- CL_teams %>% | |
| bind_cols(country_leagueCL) | |
| ``` | |
| ## clean | |
| ```{r} | |
| CL_teams_df <- CL_teams_clean %>% | |
| mutate( | |
| team_name = team_name %>% | |
| iconv(from = "UTF-8", to = "ASCII//TRANSLIT"), | |
| elo_name = case_when( | |
| team_name == "Paris Saint-Germain" ~ "Paris SG", | |
| team_name == "Club Brugge" ~ "Brugge", | |
| team_name == "Bayern Munich" ~ "Bayern", | |
| team_name == "Tottenham Hotspur" ~ "Tottenham", | |
| team_name == "Olympiacos" ~ "Olympiakos", | |
| team_name == "Red Star Belgrade" ~ "Crvena Zvezda", | |
| team_name == "Manchester City" ~ "Man City", | |
| team_name == "Shakhtar Donetsk" ~ "Shakhtar", | |
| team_name == "Atletico Madrid" ~ "Atletico", | |
| team_name == "Bayer Leverkusen" ~ "Leverkusen", | |
| team_name == "Lokomotiv Moscow" ~ "Lok Moskva", | |
| team_name == "Red Bull Salzburg" ~ "Salzburg", | |
| team_name == "Borussia Dortmund" ~ "Dortmund", | |
| team_name == "Inter Milan" ~ "Inter", | |
| team_name == "Slavia Prague" ~ "Slavia Praha", | |
| team_name == "Zenit Saint Petersburg" ~ "Zenit", | |
| TRUE ~ team_name)) %>% | |
| ## join Club info to Elo data | |
| left_join(elo_ratings_raw, by = c("elo_name" = "Club")) %>% | |
| janitor::clean_names() %>% | |
| select(-level, -from, -to, -elo_name) %>% | |
| ## fill out group names per 4 rows | |
| mutate(group = rep(LETTERS[1:12], each = 4, length.out = 32) %>% | |
| as.factor()) %>% | |
| ## per group stats | |
| group_by(group) %>% | |
| mutate(avg_elo = mean(elo), | |
| med_elo = median(elo), | |
| max_elo = max(elo), | |
| min_elo = min(elo)) %>% | |
| ungroup() %>% | |
| mutate(group = forcats::fct_reorder(group, med_elo), | |
| ## slightly nudge the Elo points so labels won't overlap | |
| ## this means the below four teams will appear on slightly different points total than reality... | |
| elo_2 = case_when( | |
| team_name == "RB Leipzig" ~ elo + 10, | |
| team_name == "Benfica" ~ elo - 10, | |
| team_name == "Shakhtar" ~ elo + 10, | |
| team_name == "Atalanta" ~ elo - 10, | |
| TRUE ~ elo)) | |
| ``` | |
| ## plot | |
| ```{r, fig.height = 7, fig.width=15} | |
| CL_teams_df %>% | |
| ggplot(aes(x = group, y = elo, group = group)) + | |
| geom_segment(aes(x = group, xend = group, | |
| y = max_elo, yend = min_elo, | |
| group = group), | |
| size = 2.25, color = "lightgrey") + | |
| geom_point(aes(y = med_elo, group = group), | |
| size = 4.5, color = "red") + | |
| geom_text(aes(y = elo_2, label = team_name), | |
| vjust = 0.5, | |
| size = 4.5, family = "Roboto Condensed", | |
| show.legend = FALSE) + | |
| geom_curve(aes(x = 8.8, xend = 8.1, | |
| y = 1825, yend = 1825), | |
| arrow = arrow(length = unit(0.07, "inch")), | |
| size = 0.5, color = "black", curvature = 0.35) + | |
| geom_text(x = 8.85, y = 1825, | |
| hjust = 0, color = "red", | |
| family = "Roboto Condensed", | |
| size = 4, | |
| label = glue::glue(" | |
| Median ELO | |
| (per group)")) + | |
| scale_x_discrete(expand = expand_scale(add = c(0.5, 1.35))) + | |
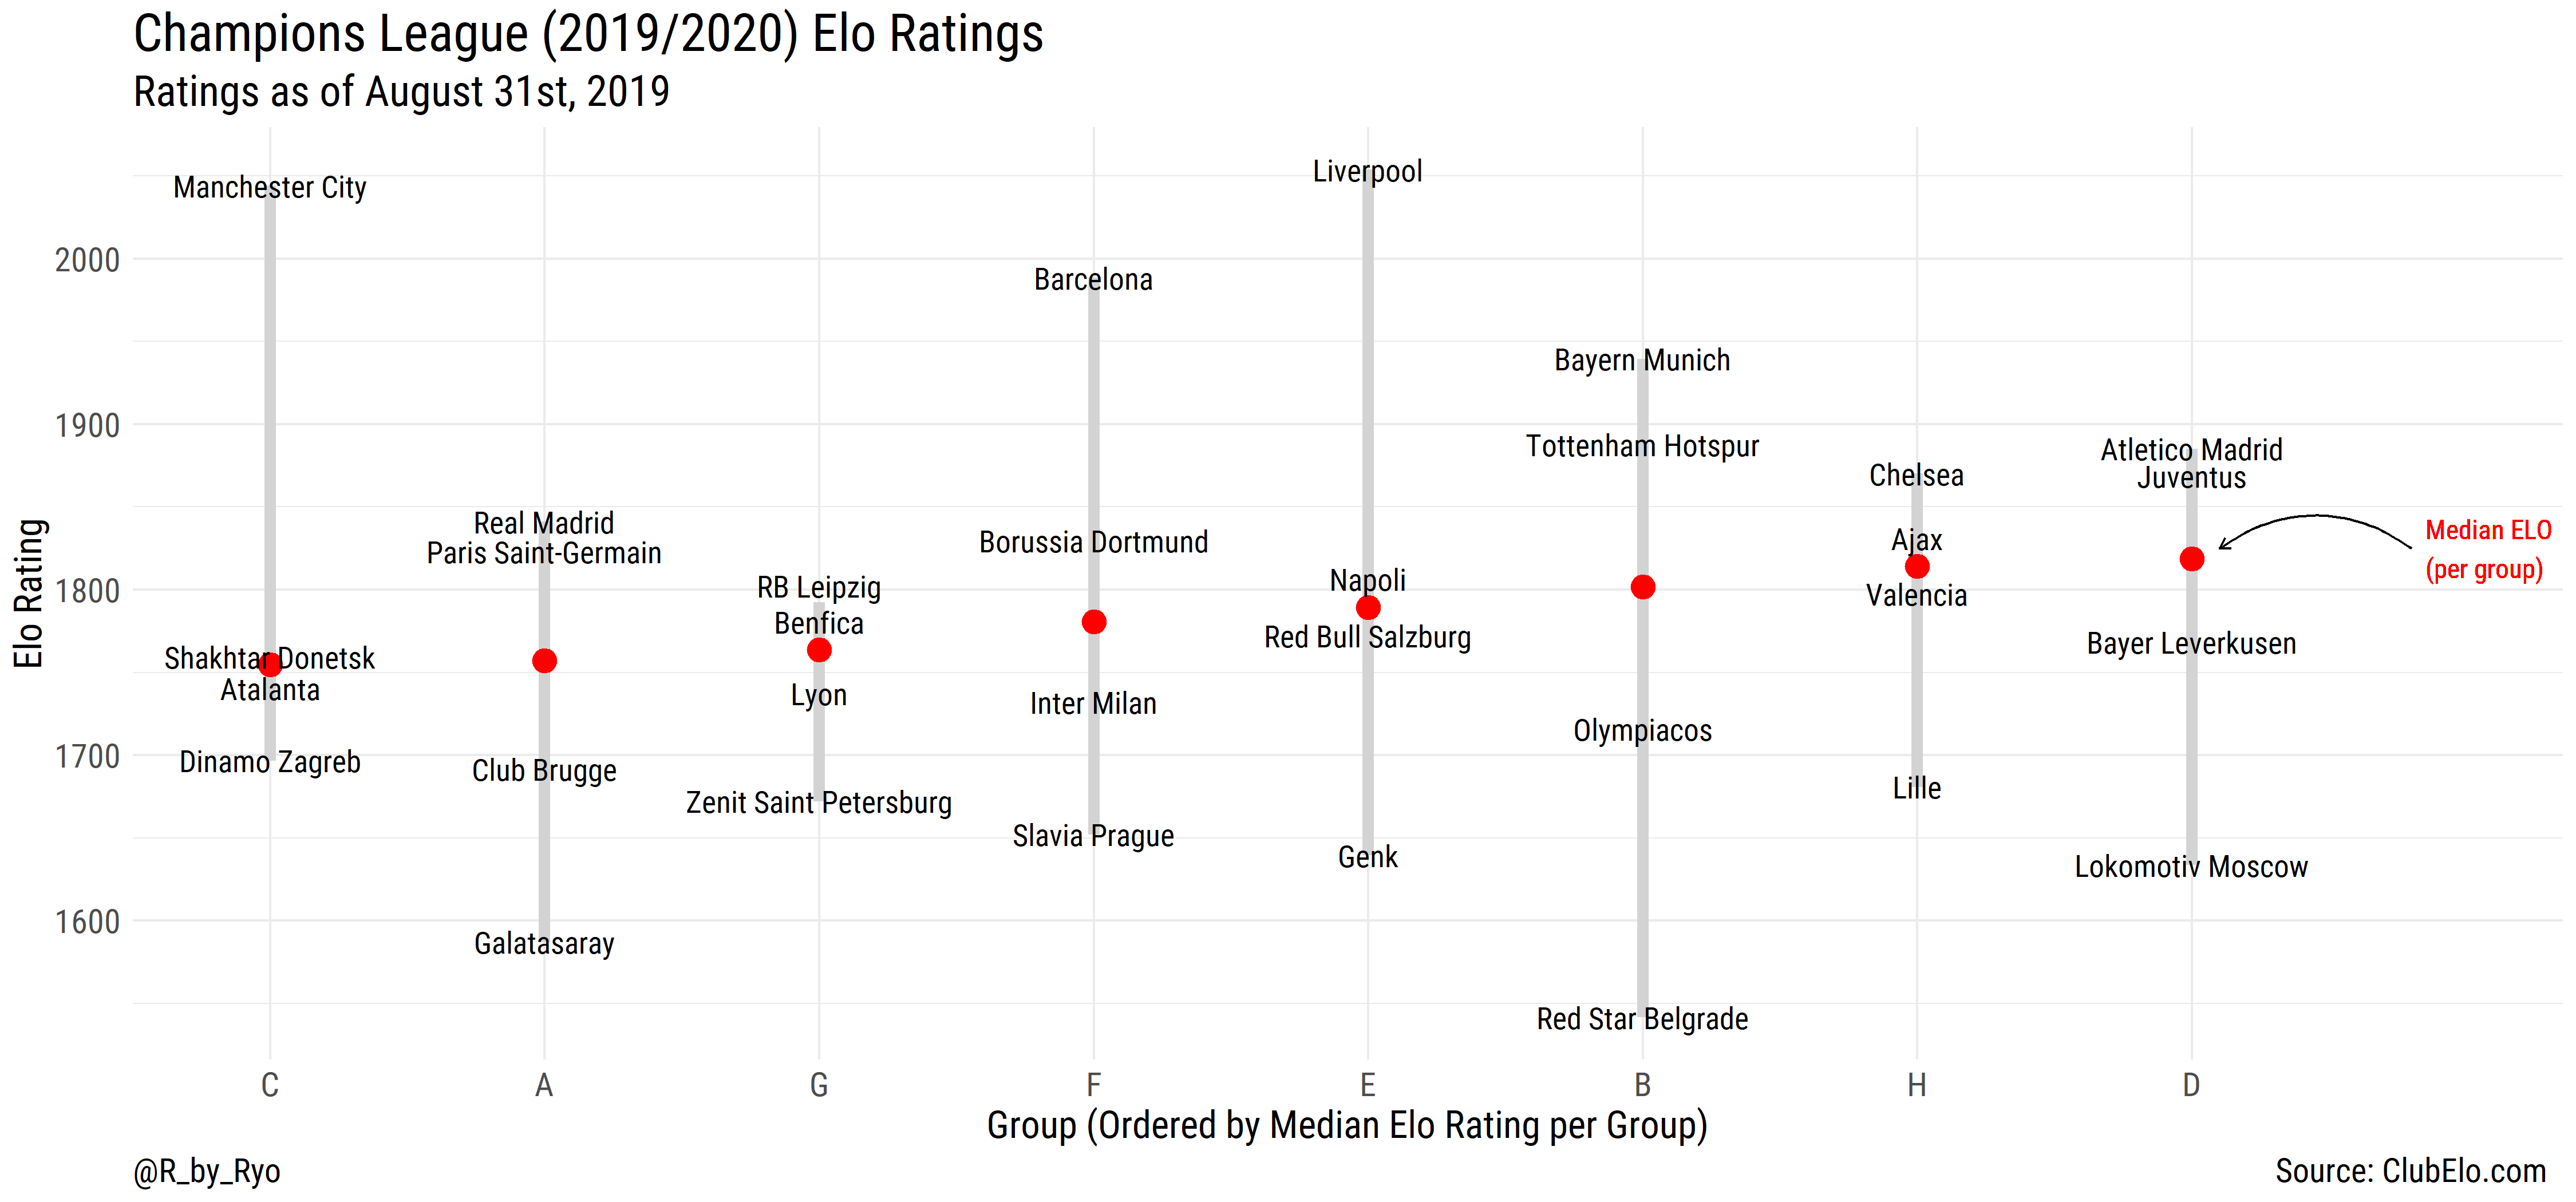
| labs(title = "Champions League (2019/2020) Elo Ratings", | |
| subtitle = "Ratings as of August 31st, 2019", | |
| x = "Group (Ordered by Median Elo Rating per Group)", | |
| y = "Elo Rating", | |
| caption = "@R_by_Ryo Source: ClubElo.com") + | |
| theme_minimal() + | |
| theme(text = element_text(family = "Roboto Condensed"), | |
| plot.title = element_text(size = 22), | |
| plot.subtitle = element_text(size = 18), | |
| plot.caption = element_text(size = 14, hjust = 0), | |
| axis.title = element_text(size = 16), | |
| axis.text = element_text(size = 14)) | |
| ``` | |
| ```{r} | |
| ggsave(filename = here::here( | |
| "Champions League & Europa League 2019-2020/outputs/champleague_eloPlot.png"), | |
| width = 15, height = 7) | |
| ``` |
Author
Ryo-N7
commented
Sep 1, 2019
Sign up for free
to join this conversation on GitHub.
Already have an account?
Sign in to comment