Created
February 6, 2019 13:42
-
-
Save SuperShinyEyes/63dc9c64b1efb8100bb014c1ed4450f0 to your computer and use it in GitHub Desktop.
This file contains hidden or bidirectional Unicode text that may be interpreted or compiled differently than what appears below. To review, open the file in an editor that reveals hidden Unicode characters.
Learn more about bidirectional Unicode characters
| def shelving(ys, cut_off, gain, mode='low'): | |
| '''Shelving filter for bass | |
| Args: | |
| ys (numpy.array): 1D signals | |
| cut_off (float): Normalized cut-off frequency. 0 < cut_off < 1 | |
| gain (float): gain in dB | |
| ''' | |
| gain = 10 ** (gain / 20) # NOTE: is it 20 or 40? | |
| wc = 2 * np.pi * cut_off / 44100 # cut_off frequency in radians(0 <= wc <= pi) | |
| tan_term = np.tan(wc / 2) | |
| gain_sqrt = np.sqrt(gain) | |
| if mode == 'low': | |
| a0_prime = tan_term + gain_sqrt | |
| a1_prime = tan_term - gain_sqrt | |
| b0_prime = gain * tan_term + gain_sqrt | |
| b1_prime = gain * tan_term - gain_sqrt | |
| else: | |
| a0_prime = gain_sqrt * tan_term + 1 | |
| a1_prime = gain_sqrt * tan_term - 1 | |
| b0_prime = gain_sqrt * tan_term + gain | |
| b1_prime = gain_sqrt * tan_term - gain | |
| a1 = a1_prime / a0_prime | |
| b0 = b0_prime / a0_prime | |
| b1 = b1_prime / a0_prime | |
| return signal.lfilter(b=[b0, b1], a=[1, a1], x=ys) |
Author
Author


Author
def shelving(cut_off, gain, mode='low'):
    '''Shelving filter for bass

    Args:
        ys (numpy.array): 1D signals
        cut_off (float): Normalized cut-off frequency. 0 < cut_off < 1
        gain (float): gain in dB
    '''
    gain        = 10 ** (gain / 20)          # NOTE: is it 20 or 40?
    wc          = 2 * np.pi * cut_off / 44100  # cut_off frequency in radians(0 <= wc <= pi)
    tan_term    = np.tan(wc / 2)
    gain_sqrt   = np.sqrt(gain)

    if mode == 'low':
        a0_prime = tan_term + gain_sqrt
        a1_prime = tan_term - gain_sqrt
        b0_prime = gain * tan_term + gain_sqrt
        b1_prime = gain * tan_term - gain_sqrt
    else:
        a0_prime = gain_sqrt * tan_term + 1
        a1_prime = gain_sqrt * tan_term - 1
        b0_prime = gain_sqrt * tan_term + gain
        b1_prime = gain_sqrt * tan_term - gain

    a1 = a1_prime / a0_prime
    b0 = b0_prime / a0_prime
    b1 = b1_prime / a0_prime

    return [b0, b1], [1, a1]

gains = (4, 8, 12)
colors = ('r', 'g', 'b')
nfft = 2**14
cut_off = 1000

fig, ax1 = plt.subplots()
ax1.set_title(f'Digital filter frequency response. Cut-off @ {cut_off} Hz')

for g, c in zip(gains, colors):
    b, a = shelving(cut_off=cut_off, gain=g, mode='low')
    w, h = freqz(b, a, nfft, whole=False)

    w *= 0.5 * sample_rate / np.pi

    # plot amplitude in dB and frequency on log scale (essentially log-log)
    # we were right, just looking at it wrong
    ax1.semilogx(w, 20 * np.log10(abs(h)), c)
    ax1.set_ylabel('Amplitude [dB]', color=c)
    ax1.set_xlabel('Frequency [Hz]')

    b, a = shelving(cut_off=cut_off, gain=-g, mode='low')
    w, h = freqz(b, a, nfft, whole=False)

    w *= 0.5 * sample_rate / np.pi

    # plot amplitude in dB and frequency on log scale (essentially log-log)
    # we were right, just looking at it wrong
    ax1.semilogx(w, 20 * np.log10(abs(h)), c)
    ax1.set_ylabel('Amplitude [dB]', color=c)
    ax1.set_xlabel('Frequency [Hz]')

ax1.axvline(x=cut_off, label=f'cut-off at {cut_off} Hz', linestyle=(0, (5, 5)), color='black')
Sign up for free
to join this conversation on GitHub.
Already have an account?
Sign in to comment
gain = 10
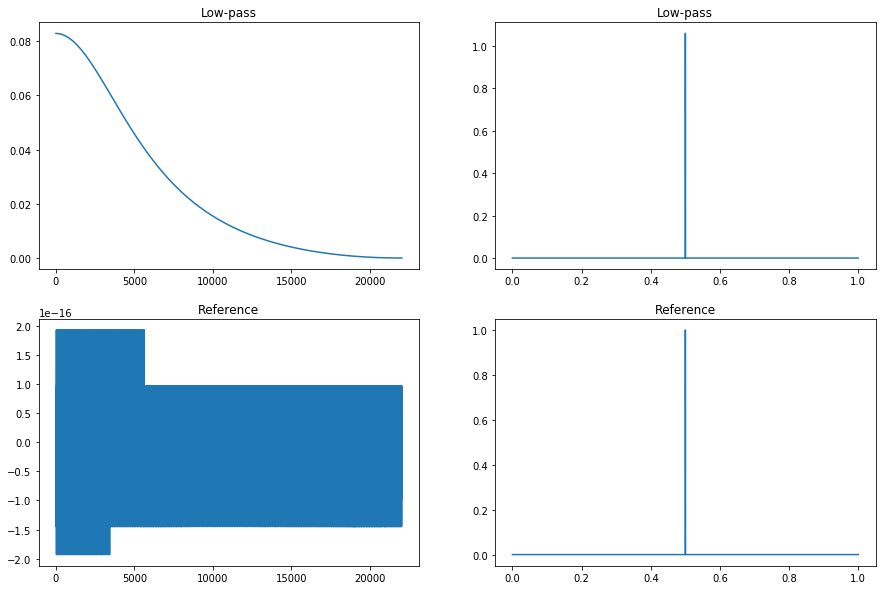
wc = np.pi / 4
gain = 100
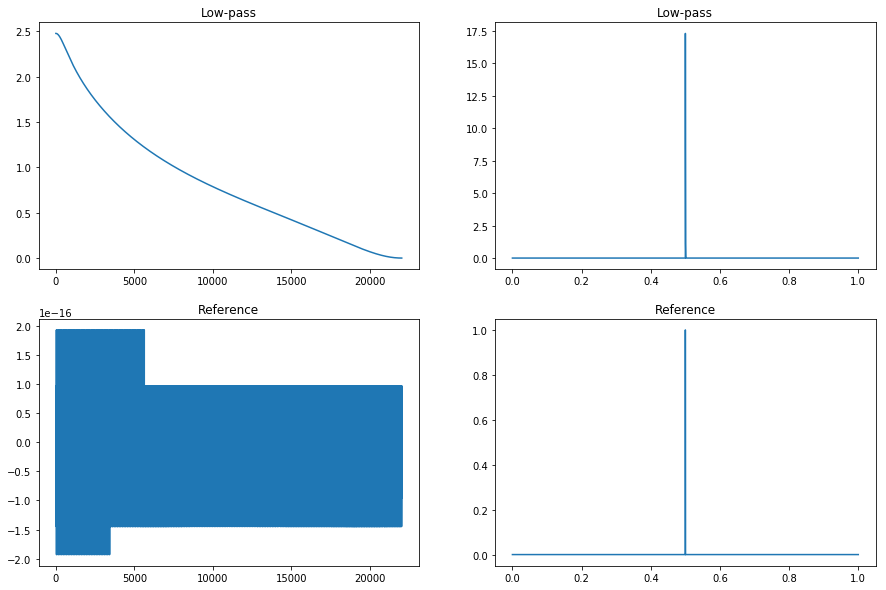
wc = np.pi / 4
gain = 1.1
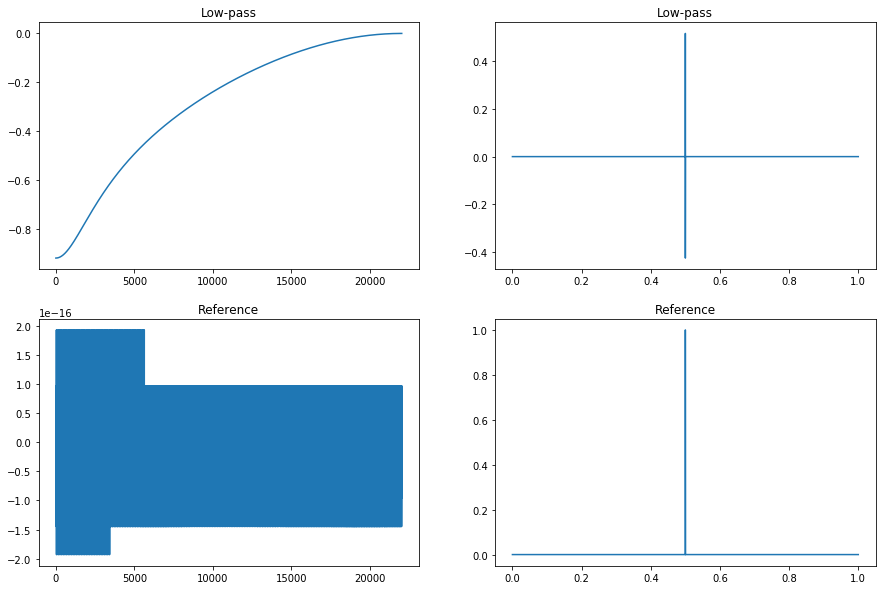
wc = np.pi / 4