Created
June 9, 2020 15:33
-
-
Save Vindaar/cb42e7a7787a5de5f40e7dcfd80f7b5f to your computer and use it in GitHub Desktop.
This file contains hidden or bidirectional Unicode text that may be interpreted or compiled differently than what appears below. To review, open the file in an editor that reveals hidden Unicode characters.
Learn more about bidirectional Unicode characters
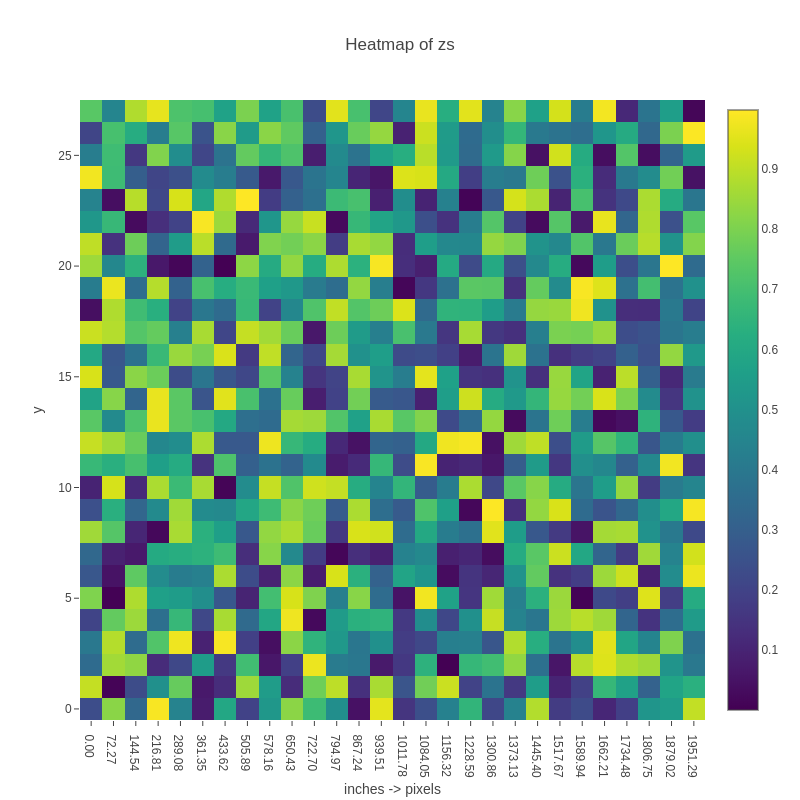
| import plotly, random, sequtils | |
| import json # to modify json | |
| import strformat # to format the tick texts | |
| # let's assume the 28 correspond to 28 inches and we want to print the | |
| # x axis values in pixels using a dpi of 72.27 | |
| var zs = newSeqWith(28, newSeq[float32](28)) | |
| for x in 0 ..< 28: | |
| for y in 0 ..< 28: | |
| zs[x][y] = rand(1.0) | |
| # create a heatmap and convert to a `PlotJson` object | |
| let plt = heatmap(zs).toPlotJson | |
| # replace the existing layout["xaxis"] with custom vals | |
| plt.layout["xaxis"] = %* { | |
| "tickvals" : toSeq(0 .. 27), | |
| "ticktext" : toSeq(0 .. 27).mapIt(&"{it.float * 72.27:.2f}"), | |
| "title" : "inches -> pixels" | |
| } | |
| plt.show() |
Author
Vindaar
commented
Jun 9, 2020
Sign up for free
to join this conversation on GitHub.
Already have an account?
Sign in to comment