library("ggplot2")
library("ggdist")
library("latex2exp")
set.seed(42)
means <- rnorm(4)
df_slabplot <- rbind(
data.frame(
method = "hmc",
bj = rnorm(4000, mean = rep(means, each = 1000)),
association = as.character(1),
chain = rep(1:4, each = 1000)
),
data.frame(
method = "vb",
bj = rnorm(1000),
association = as.character(1),
chain = "vb"
)
)
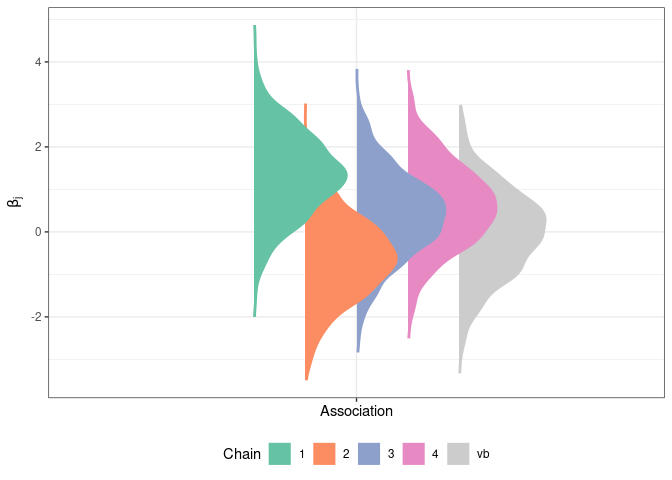
## I want to compare densities, showing both both "chain" and "method"
## I can do chain easily
ggplot(df_slabplot) +
aes(x = association, y = bj, fill = chain, colour = chain) +
stat_slab(position = position_dodge(width = 0.5)) +
labs(x = "Association", y = TeX("$\\beta_j$")) +
scale_fill_manual(
name = "Chain",
aesthetics = c("fill", "colour"),
values = setNames(
c("#66c2a5", "#fc8d62", "#8da0cb", "#e78ac3", "grey80"),
c(1:4, "vb")
)
) +
theme_bw() +
theme(
legend.position = "bottom",
axis.text.x = element_blank()
)
## I can group by "method", like this:
ggplot(df_slabplot) +
    aes(x = association, y = bj, group = method, fill = chain, colour = chain) +
    stat_slab(position = position_dodge(width = 0.5)) +
    labs(x = "Association", y = TeX("$\\beta_j$")) +
    scale_fill_manual(
        name = "Chain",
        aesthetics = c("fill", "colour"),
        values = setNames(
            c("#66c2a5", "#fc8d62", "#8da0cb", "#e78ac3", "grey80"),
            c(1:4, "vb")
        )
    ) +
    theme_bw() +
    theme(
        legend.position = "bottom",
        axis.text.x = element_blank()
    )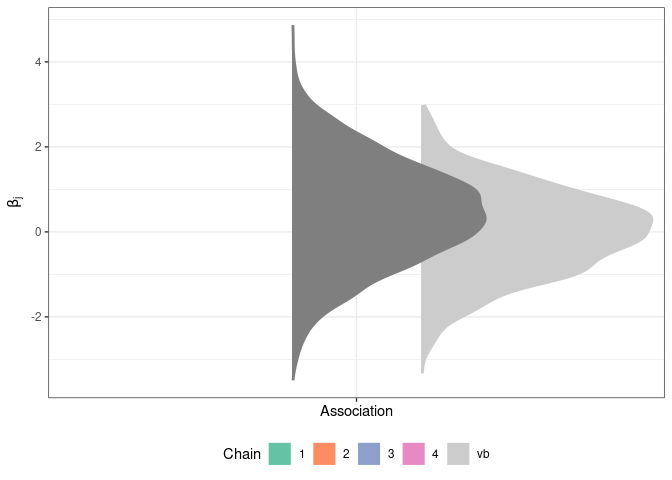
## but this means the chain information is missing


## I want chains 1-4 to be shown as one PDF, a bit like this:
ggplot(df_slabplot) +
    aes(y = bj, fill = chain, colour = chain) +
    geom_density(position = "stack") +
    labs(y = TeX("$\\beta_j$")) +
    scale_fill_manual(
        name = "Chain",
        aesthetics = c("fill", "colour"),
        values = setNames(
            c("#66c2a5", "#fc8d62", "#8da0cb", "#e78ac3", "grey80"),
            c(1:4, "vb")
        )
    ) +
    theme_bw() +
    theme(
        legend.position = "bottom",
        axis.text.x = element_blank()
    )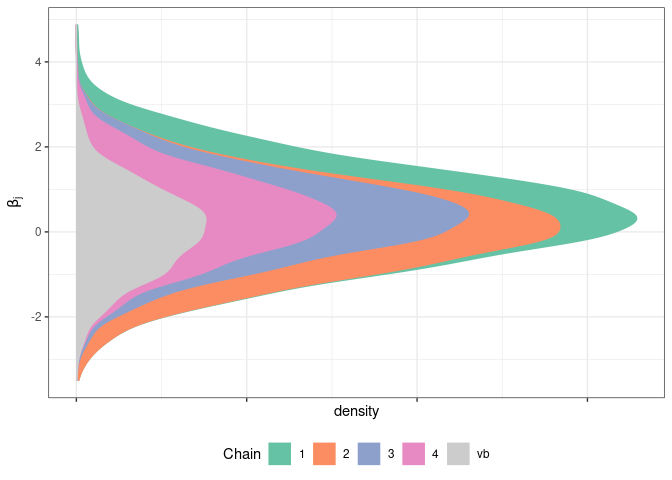
## but the "vb" chain to be shown separately. And ideally to be able
## to show multiple of these figures along the x-axis (so like a slab/violin geom)


