Skip to content

Instantly share code, notes, and snippets.

@amelieykw
Last active April 20, 2018 09:47
Show Gist options
  • Save amelieykw/bb2dbac25c17ddb3061b5cfbc0cb585b to your computer and use it in GitHub Desktop.
Save amelieykw/bb2dbac25c17ddb3061b5cfbc0cb585b to your computer and use it in GitHub Desktop.
[Highcharts - 00 - Getting Started] #Highcharts #GettingStarted #Your1stChart

A. Include Highcharts

load from ajax.googleapis.com and code.highcharts.com

In the <head> section :

<script src="https://code.highcharts.com/highcharts.js"></script>

for IE6, 7 or 8 (in a conditional comment that hides it from modern browsers):

<!--[if lt IE 9]>
<script src="https://code.highcharts.com/modules/oldie.js"></script>
<![endif]-->

B. Alternatively, load files from your own domain

download from highcharts.com and put on your own webpage

Example with Highcharts served from your own server :

<script src="/js/highcharts.js"></script>

C. Load Highstock or Highmaps

Highcharts is already included in Highstock, so it is not necessary to load both.

  • Highstock.js
    • include Highcharts.js
  • Highmaps.js
    • not include the complete Highcharts feature set

Highstock and Highmaps can be loaded separate files like this:

<script src="/js/highstock.js"></script>
<script src="/js/highmaps.js"></script>

if stock or maps are required in the same page as each other or with basic Highcharts, they can be loaded as modules :

the separate files can't run in the same page along with each other or with highcharts.js

<script src="/js/highcharts.js"></script>
<script src="/js/modules/stock.js"></script>
<script src="/js/modules/map.js"></script>

Original Website

01 - Include Highcharts in your webpage

With Highcharts included in your webpage you are ready to create your first chart.

02 - start by creating a simple bar chart

1. Add a div in your webpage.

Give it an id and set a specific width and height which will be the width and height of your chart.

<div id="container" style="width:100%; height:400px;"></div>

2. A chart is initialized by adding the JavaScript tag, <script> </script>

anywhere in a webpage, containing the following code.

The div from #1 is referenced in the constructor.

$(function () { 
    var myChart = Highcharts.chart('container', {
        chart: {
            type: 'bar'
        },
        title: {
            text: 'Fruit Consumption'
        },
        xAxis: {
            categories: ['Apples', 'Bananas', 'Oranges']
        },
        yAxis: {
            title: {
                text: 'Fruit eaten'
            }
        },
        series: [{
            name: 'Jane',
            data: [1, 0, 4]
        }, {
            name: 'John',
            data: [5, 7, 3]
        }]
    });
});

The code above uses the jQuery specific way of launching code on document ready, but this can be replace by general onready handlers.

In these charts, typically the data is supplied in a separate JavaScript array, either taken from a separate JavaScript file or by an Ajax call to the server.

If you are inserting a Stock chart, there is a separate constructor method called Highcharts.StockChart.

var chart1; // globally available

$(function() {
	chart1 = Highcharts.stockChart('container', {
		rangeSelector: {
			selected: 1
        },
        series: [{
            name: 'USD to EUR',
            data: usdtoeur // predefined JavaScript array
        }]
    });
});

3. You should now see this chart on your webpage

4. (Optionally) apply a global theme to your charts

A theme = just a set of options that are applied globally through the Highcharts.setOptions method.

The download package comes with four predefined themes. To apply a theme from one of these files, add this directly after the highcharts.js file inclusion:

<script type="text/javascript" src="/js/themes/gray.js"></script>

How to set options

a list of online examples of the examples shown in this articles :

<script src="https://code.jquery.com/jquery-3.1.1.min.js"></script>
<script src="https://code.highcharts.com/stock/highstock.js"></script>
<script src="https://code.highcharts.com/stock/modules/exporting.js"></script>
<script src="https://code.highcharts.com/stock/modules/export-data.js"></script>

<div id="container" style="height: 400px; min-width: 310px"></div>
$.getJSON('https://www.highcharts.com/samples/data/aapl-c.json', function (data) {
    // Create the chart
    Highcharts.stockChart('container', {


        rangeSelector: {
            selected: 1
        },

        title: {
            text: 'AAPL Stock Price'
        },

        series: [{
            name: 'AAPL',
            data: data,
            tooltip: {
                valueDecimals: 2
            }
        }]
    });
});

Highcharts use a JavaScript object structure to define the options or settings of a chart.

This article explains :

  1. how the options object works
  2. how to use it.

THE OPTIONS OBJECT

When you initialize the chart using its constructor Highcharts.Chart, the options object is the first parameter you pass.

In the example below the code marked as red represents the options object:

$(function() {
    var chart1 = Highcharts.chart({
    	/* red part
        chart: {
            renderTo: 'container',
            type: 'bar'
        },
        title: {
            text: 'Fruit Consumption'
        },
        xAxis: {
            categories: ['Apples', 'Bananas', 'Oranges']
        },
        yAxis: {
            title: {
                text: 'Fruit eaten'
            }
        },
        series: [{
            name: 'Jane',
            data: [1, 0, 4]
        }, {
            name: 'John',
            data: [5, 7, 3]
        }]
    }*/ );
});

To get the most out of Highcharts, it is important to understand how the options object works and how it can be altered programmatically.

some key concepts on JavaScript objects:

dot notation VS object literal notation

// Bad code:
var options = new Object();

options.chart = new Object();
options.chart.renderTo = 'container';
options.chart.type = 'bar';

options.series = new Array();
options.series[0] = new Object();
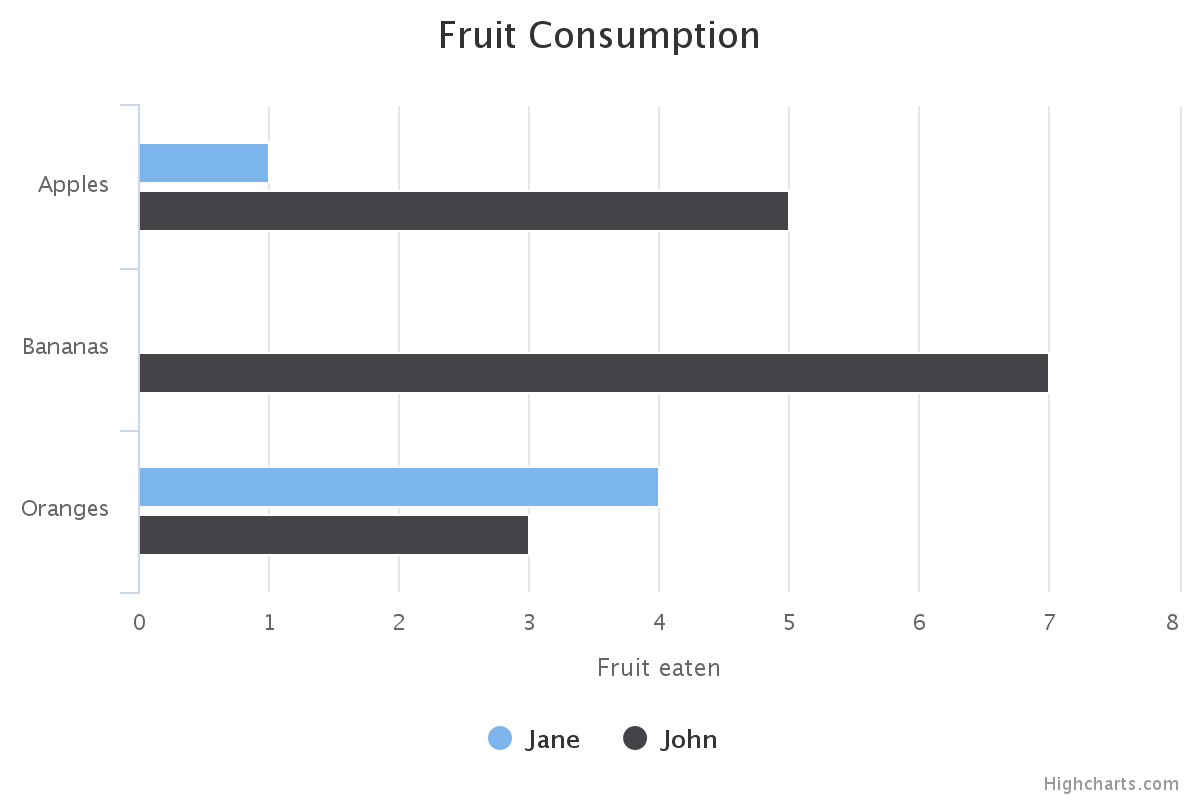
options.series[0].name = 'Jane';
options.series[0].data = new Array(1, 0, 4);
// Good code:
var options = {
    chart: {
        renderTo: 'container',
        type: 'bar'
    },
    series: [{
        name: 'Jane',
        data: [1, 0, 4]
    }]
};

In the example above the options object is created by itself and can be added to the chart by passing it to the chart constructor:

$(document).ready(function() {
    var chart = new Highcharts.Chart(options);
});

After an object is created using the object literal notation, we can extend its members by the dot notation.

Say we have an object like defined in the "Good code" above. The code below adds another series to it.

Remember options.series is an array, so it has a push method.

options.series.push({
    name: 'John',
    data: [3, 4, 2]
})

Another fact that can come in handy when working on JavaScript objects, is that :

  • the dot notation = quare bracket notation

so you can cess all members by their string names

Which in practice means that

options.renderTo

is always the same as:

options['renderTo']

GLOBAL OPTIONS

If you want to apply a set of options to all charts on the same page, use Highcharts.setOptions like shown below :

$(function() {
    Highcharts.setOptions({
        chart: {
            backgroundColor: {
                linearGradient: [0, 0, 500, 500],
                stops: [
                    [0, 'rgb(255, 255, 255)'],
                    [1, 'rgb(240, 240, 255)']
                    ]
            },
            borderWidth: 2,
            plotBackgroundColor: 'rgba(255, 255, 255, .9)',
            plotShadow: true,
            plotBorderWidth: 1
        }
    });
    
    var chart1 = new Highcharts.Chart({
        chart: {
            renderTo: 'container',
        },

        xAxis: {
            type: 'datetime'
        },

        series: [{
            data: [29.9, 71.5, 106.4, 129.2, 144.0, 176.0, 135.6, 148.5, 216.4, 194.1, 95.6, 54.4],
            pointStart: Date.UTC(2010, 0, 1),
            pointInterval: 3600 * 1000 // one hour
        }]
    });

    var chart2 = new Highcharts.Chart({
        chart: {
            renderTo: 'container2',
            type: 'column'
        },

        xAxis: {
            type: 'datetime'
        },

        series: [{
            data: [29.9, 71.5, 106.4, 129.2, 144.0, 176.0, 135.6, 148.5, 216.4, 194.1, 95.6, 54.4],
            pointStart: Date.UTC(2010, 0, 1),
            pointInterval: 3600 * 1000 // one hour
        }]
    });
});

For a full reference of the options available, see the Highcharts options reference or the Highstock options reference.

Sign up for free to join this conversation on GitHub. Already have an account? Sign in to comment