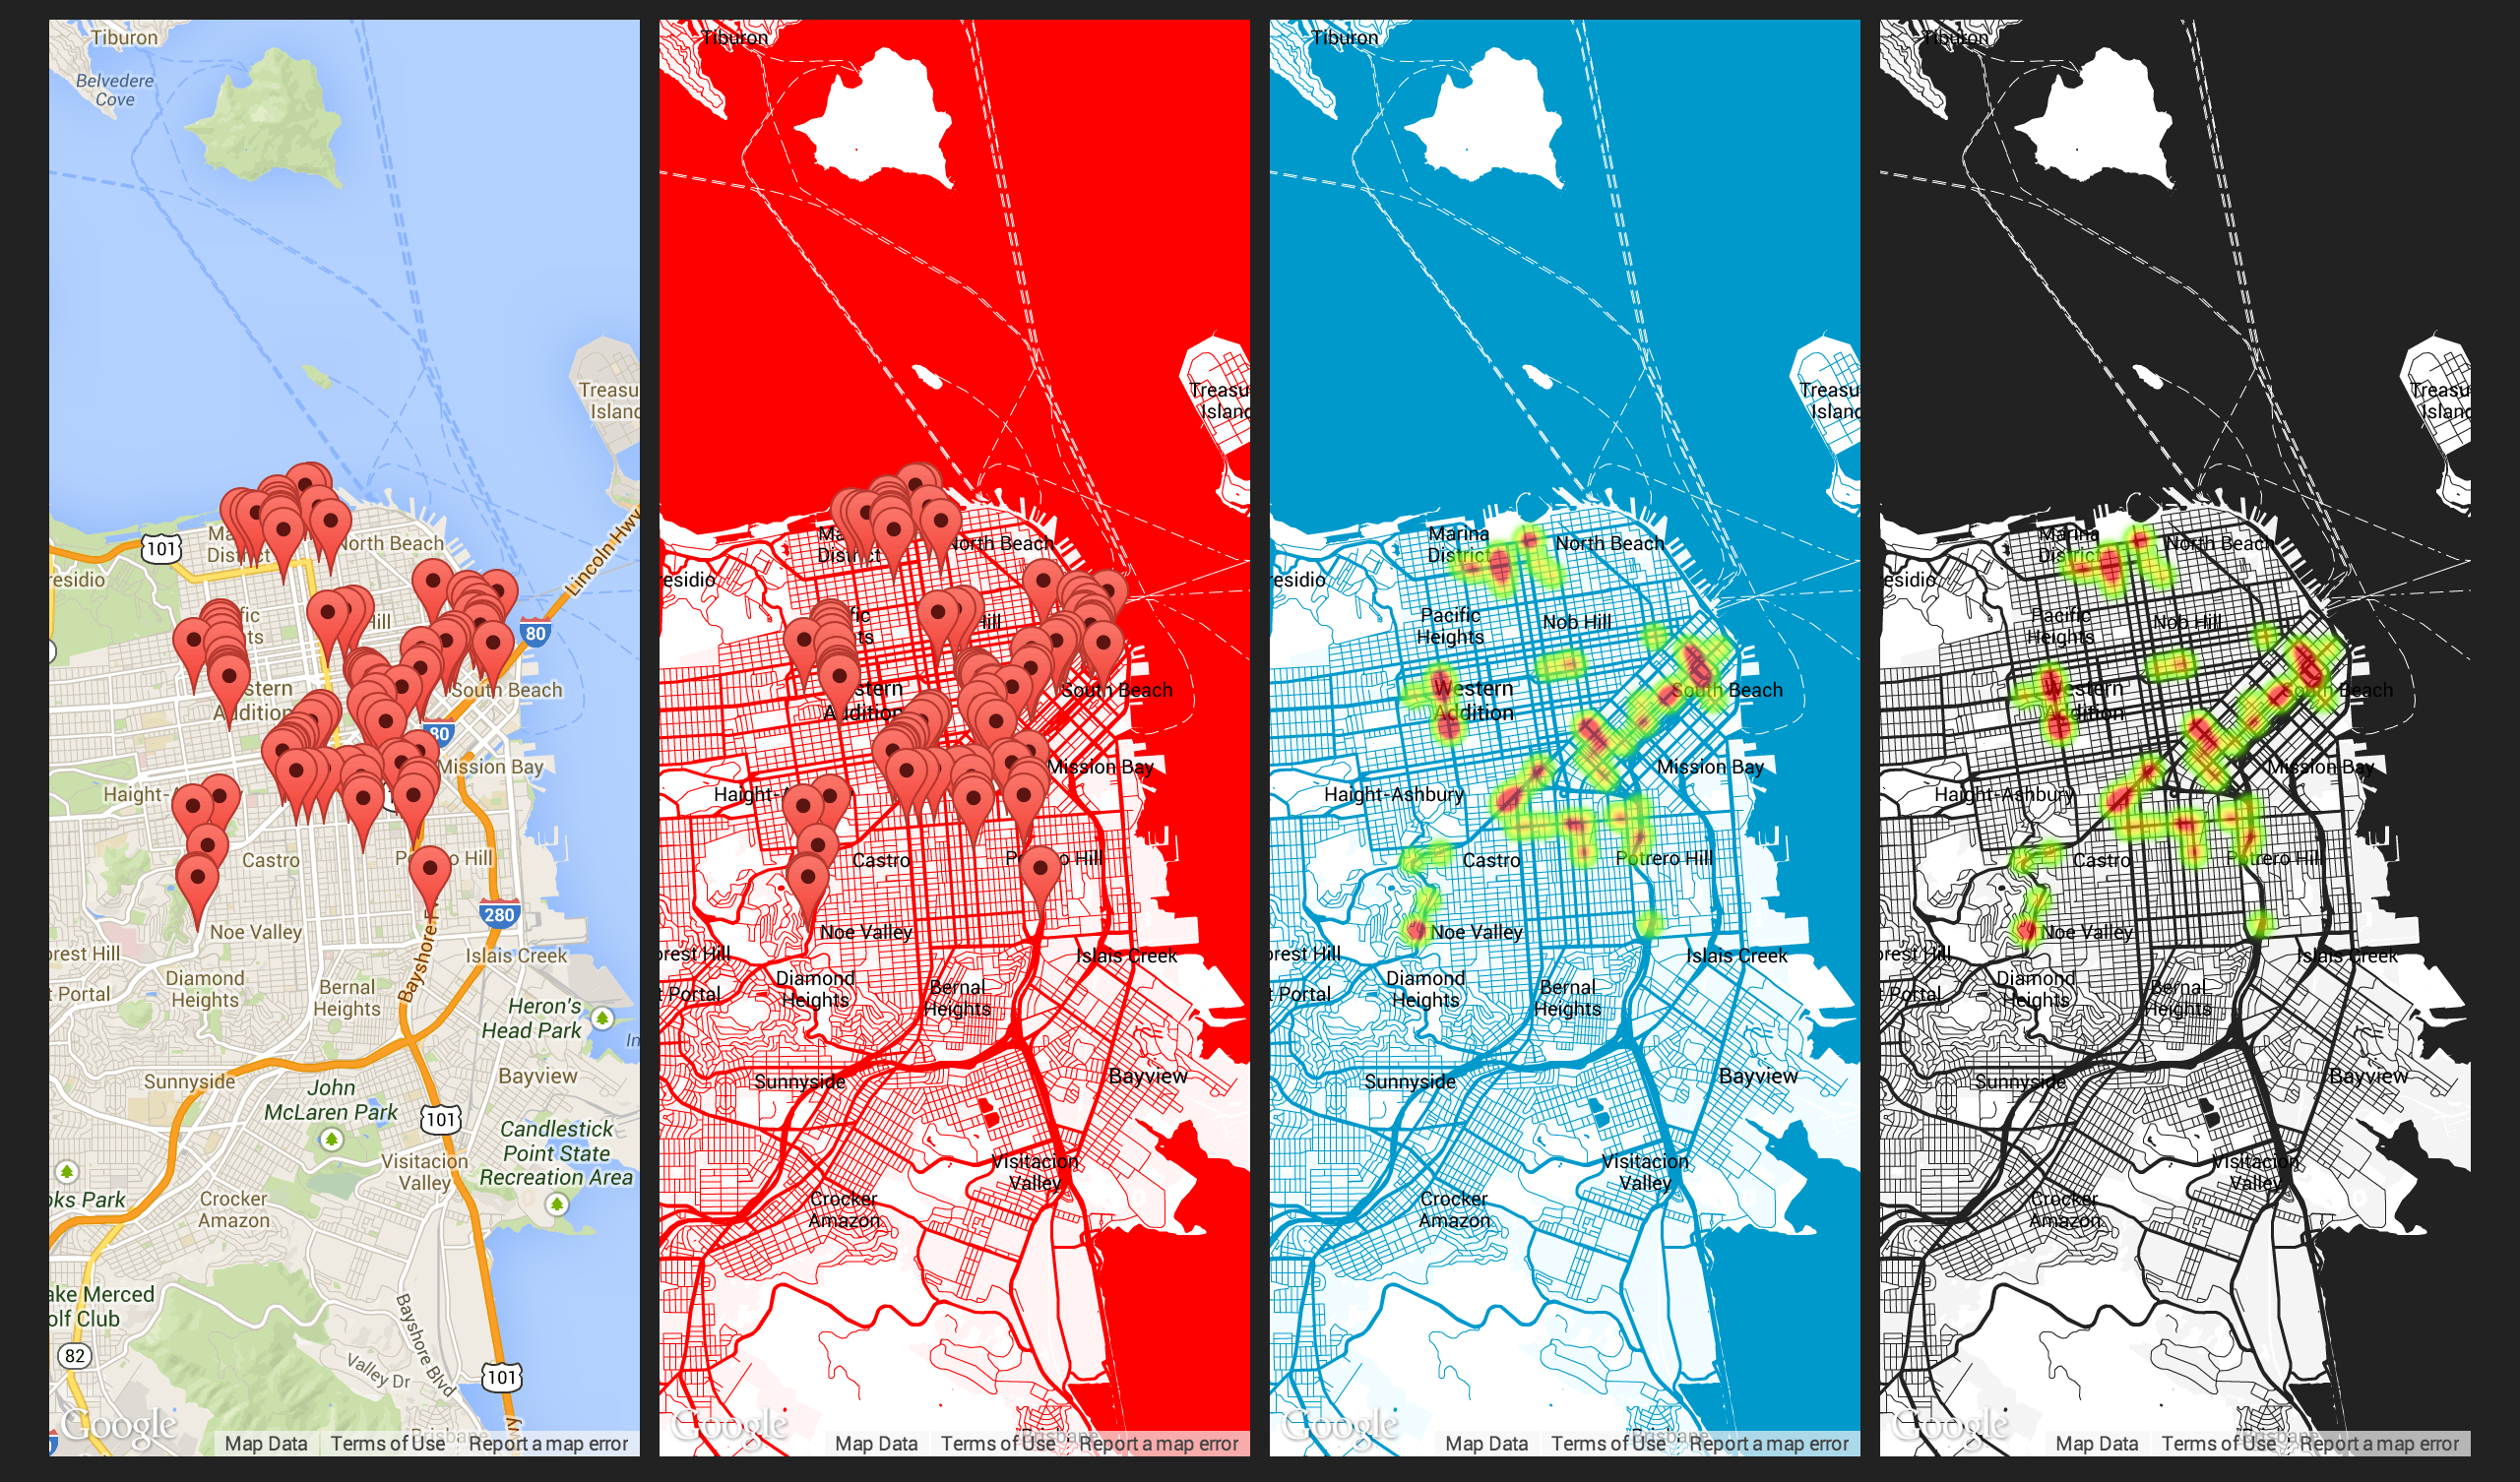
|
class Dashing.Map extends Dashing.Widget |
|
|
|
ready: -> |
|
$(@node).removeClass('widget') |
|
color = $(@node).data("color") |
|
|
|
if color |
|
style = [ |
|
{ |
|
"featureType": "water", |
|
"stylers": [ |
|
{ "color": color } |
|
] |
|
},{ |
|
"featureType": "road", |
|
"stylers": [ |
|
{ "color": color }, |
|
{ "weight": 0.5 } |
|
] |
|
},{ |
|
"featureType": "poi.government", |
|
"stylers": [ |
|
{ "lightness": 95 }, |
|
{ "visibility": "off" } |
|
] |
|
},{ |
|
"featureType": "transit", |
|
"stylers": [ |
|
{ "color": "#ffffff" } |
|
] |
|
},{ |
|
"featureType": "transit", |
|
"elementType" : "geometry", |
|
"stylers": [ |
|
{ "weight": 0.5 } |
|
] |
|
},{ |
|
"featureType": "transit", |
|
"elementType": "labels", |
|
"stylers": [ |
|
{ "visibility": "off" } |
|
] |
|
},{ |
|
"featureType": "road", |
|
"elementType": "labels", |
|
"stylers": [ |
|
{ "visibility": "off" } |
|
] |
|
},{ |
|
"featureType": "poi", |
|
"elementType": "labels", |
|
"stylers": [ |
|
{ "visibility": "off" } |
|
] |
|
},{ |
|
"featureType": "administrative.land_parcel" },{ |
|
"featureType": "poi.park", |
|
"stylers": [ |
|
{ "lightness": 90 }, |
|
{ "color": "#ffffff" } |
|
] |
|
},{ |
|
"featureType": "landscape", |
|
"stylers": [ |
|
{ "color": "#ffffff" }, |
|
{ "visibility": "on" } |
|
] |
|
},{ |
|
"featureType": "poi.park", |
|
"stylers": [ |
|
{ "color": "#ffffff" } |
|
] |
|
},{ |
|
"featureType": "landscape.man_made", |
|
"stylers": [ |
|
{ "color": color }, |
|
{ "lightness": 95 } |
|
] |
|
},{ |
|
"featureType": "poi", |
|
"stylers": [ |
|
{ "visibility": "on" }, |
|
{ "color": "#ffffff" } |
|
] |
|
},{ |
|
"featureType": "poi", |
|
"elementType": "labels", |
|
"stylers": [ |
|
{ "visibility": "off" } |
|
] |
|
},{ |
|
"featureType": "landscape", |
|
"elementType": "labels", |
|
"stylers": [ |
|
{ "visibility": "off" } |
|
] |
|
},{ |
|
"featureType": "administrative.province", |
|
"elementType": "labels", |
|
"stylers": [ |
|
{ "visibility": "off" } |
|
] |
|
},{ |
|
"elementType": "administrative.locality", |
|
"elementType": "labels", |
|
"stylers": [ |
|
{ "color": "#000000" }, |
|
{ "weight": 0.1 } |
|
] |
|
},{ |
|
"featureType": "administrative.country", |
|
"elementType": "labels.text", |
|
"stylers": [ |
|
{ "color": "#000000" }, |
|
{ "weight": 0.1 } |
|
] |
|
},{ |
|
"featureType": "administrative.country", |
|
"elementType": "geometry", |
|
"stylers": [ |
|
{ "color": color }, |
|
{ "weight": 1.0 } |
|
] |
|
},{ |
|
"featureType": "administrative.province", |
|
"elementType": "geometry", |
|
"stylers": [ |
|
{ "color": color }, |
|
{ "weight": 0.5 } |
|
] |
|
},{ |
|
"featureType": "water", |
|
"elementType": "labels", |
|
"stylers": [ |
|
{ "visibility": "off" } |
|
] |
|
} |
|
] |
|
else |
|
[] |
|
|
|
options = |
|
zoom: 2 |
|
center: new google.maps.LatLng(30, -98) |
|
disableDefaultUI: true |
|
draggable: false |
|
scrollwheel: false |
|
disableDoubleClickZoom: true |
|
styles: style |
|
|
|
mapTypeId: google.maps.MapTypeId.ROADMAP |
|
@map = new google.maps.Map $(@node)[0], options |
|
@heat = [] |
|
@markers = [] |
|
|
|
onData: (data) -> |
|
return unless @map |
|
if $(@node).data("type") == 'heat' |
|
marker.set('map', null) for marker in @heat |
|
@markers = [] |
|
|
|
@markers.push new google.maps.LatLng(marker[0],marker[1]) for marker in data.markers |
|
|
|
pointArray = new google.maps.MVCArray @markers |
|
@heat.push new google.maps.visualization.HeatmapLayer |
|
data: pointArray |
|
map: @map |
|
|
|
else |
|
marker.set('map', null) for marker in @markers |
|
@markers = [] |
|
for marker in data.markers |
|
marker_object = new google.maps.Marker |
|
position: new google.maps.LatLng(marker[0],marker[1]) |
|
map: @map |
|
@markers.push marker_object |
|
|
|
if @markers.length == 1 |
|
@map.set('zoom', 9) |
|
@map.set('center', @markers[0].position) |
|
else |
|
bounds = new google.maps.LatLngBounds |
|
bounds.extend(marker.position || marker) for marker in @markers |
|
@map.panToBounds(bounds) |
|
@map.fitBounds(bounds) |


Is there a sample job that shows how data gets to the widget?