Created
March 24, 2020 12:35
-
-
Save aniarya82/ae43af3366d26af13e7983060ff1c458 to your computer and use it in GitHub Desktop.
This code from Medium article on efficient frontier example. [link](https://medium.com/python-data/effient-frontier-in-python-34b0c3043314)
This file contains hidden or bidirectional Unicode text that may be interpreted or compiled differently than what appears below. To review, open the file in an editor that reveals hidden Unicode characters.
Learn more about bidirectional Unicode characters
| # import needed modules | |
| import quandl | |
| import pandas as pd | |
| import numpy as np | |
| import matplotlib.pyplot as plt | |
| # get adjusted closing prices of 5 selected companies with Quandl | |
| quandl.ApiConfig.api_key = 'zcfJ6696mcZScjzsyeta' | |
| selected = ['CNP', 'F', 'WMT', 'GE', 'TSLA'] | |
| data = quandl.get_table('WIKI/PRICES', ticker = selected, | |
| qopts = { 'columns': ['date', 'ticker', 'adj_close'] }, | |
| date = { 'gte': '2014-1-1', 'lte': '2016-12-31' }, paginate=True) | |
| # reorganise data pulled by setting date as index with | |
| # columns of tickers and their corresponding adjusted prices | |
| clean = data.set_index('date') | |
| table = clean.pivot(columns='ticker') | |
| # calculate daily and annual returns of the stocks | |
| returns_daily = table.pct_change() | |
| returns_annual = returns_daily.mean() * 250 | |
| # get daily and covariance of returns of the stock | |
| cov_daily = returns_daily.cov() | |
| cov_annual = cov_daily * 250 | |
| # empty lists to store returns, volatility and weights of imiginary portfolios | |
| port_returns = [] | |
| port_volatility = [] | |
| stock_weights = [] | |
| # set the number of combinations for imaginary portfolios | |
| num_assets = len(selected) | |
| num_portfolios = 50000 | |
| # populate the empty lists with each portfolios returns,risk and weights | |
| for single_portfolio in range(num_portfolios): | |
| weights = np.random.random(num_assets) | |
| weights /= np.sum(weights) | |
| returns = np.dot(weights, returns_annual) | |
| volatility = np.sqrt(np.dot(weights.T, np.dot(cov_annual, weights))) | |
| port_returns.append(returns) | |
| port_volatility.append(volatility) | |
| stock_weights.append(weights) | |
| # a dictionary for Returns and Risk values of each portfolio | |
| portfolio = {'Returns': port_returns, | |
| 'Volatility': port_volatility} | |
| # extend original dictionary to accomodate each ticker and weight in the portfolio | |
| for counter,symbol in enumerate(selected): | |
| portfolio[symbol+' Weight'] = [Weight[counter] for Weight in stock_weights] | |
| # make a nice dataframe of the extended dictionary | |
| df = pd.DataFrame(portfolio) | |
| # get better labels for desired arrangement of columns | |
| column_order = ['Returns', 'Volatility'] + [stock+' Weight' for stock in selected] | |
| # reorder dataframe columns | |
| df = df[column_order] | |
| # plot the efficient frontier with a scatter plot | |
| plt.style.use('seaborn') | |
| df.plot.scatter(x='Volatility', y='Returns', figsize=(10, 8), grid=True) | |
| plt.xlabel('Volatility (Std. Deviation)') | |
| plt.ylabel('Expected Returns') | |
| plt.title('Efficient Frontier') | |
| plt.show() |
Sign up for free
to join this conversation on GitHub.
Already have an account?
Sign in to comment
This is link of the medium article where the code was mentioned.
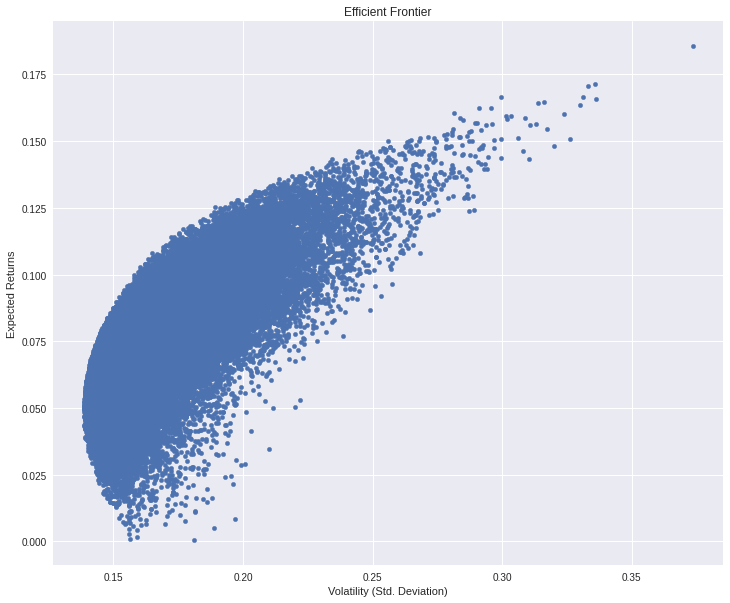
attached in image created by above code.