Created
April 19, 2022 18:10
-
-
Save asehmi/b49120b2f16dd244dabec9cb49474347 to your computer and use it in GitHub Desktop.
Plotting voxels in Streamlit
This file contains hidden or bidirectional Unicode text that may be interpreted or compiled differently than what appears below. To review, open the file in an editor that reveals hidden Unicode characters.
Learn more about bidirectional Unicode characters
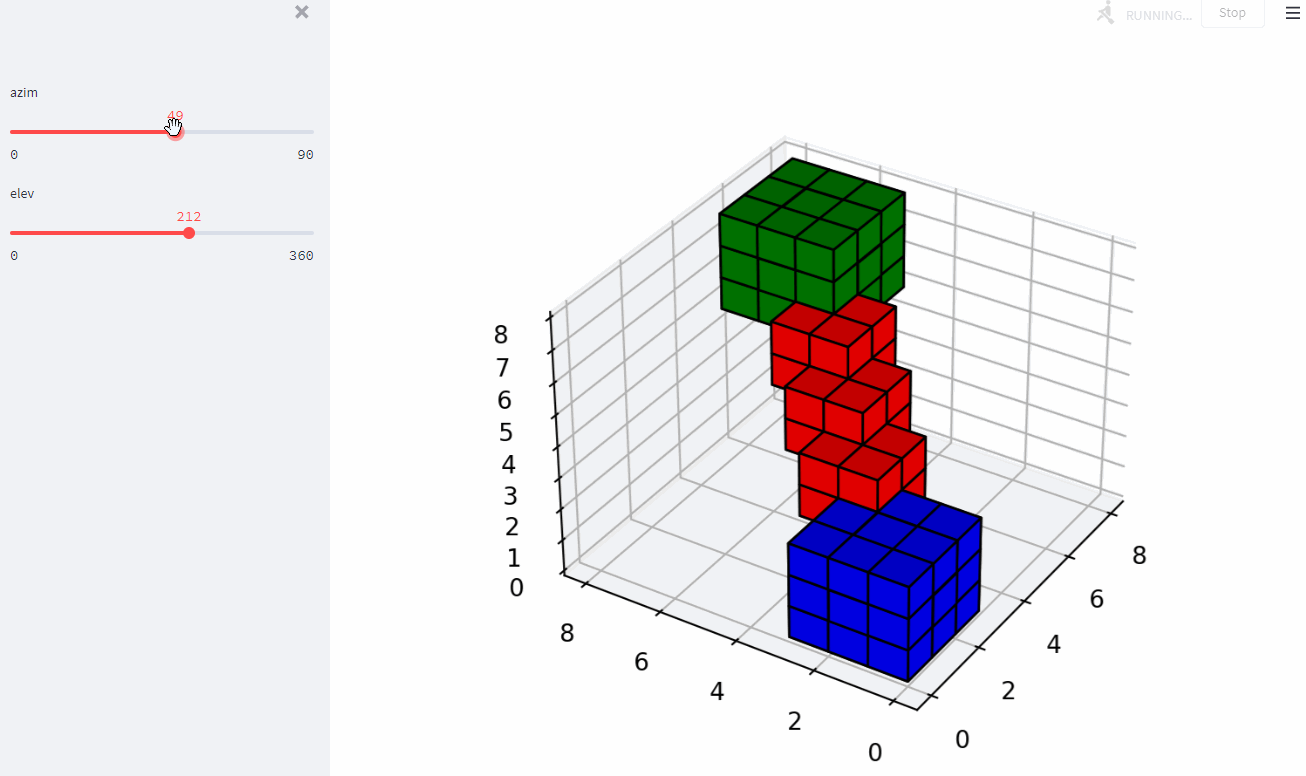
| """From https://matplotlib.org/3.1.0/gallery/mplot3d/voxels.html in Streamlit""" | |
| import matplotlib.pyplot as plt | |
| import numpy as np | |
| import streamlit as st | |
| # This import registers the 3D projection, but is otherwise unused. | |
| from mpl_toolkits.mplot3d import Axes3D # noqa: F401 unused import | |
| @st.cache | |
| def generate_data(): | |
| """Let's put the data in cache so it doesn't reload each time we rerun the script when modifying the slider""" | |
| # prepare some coordinates | |
| x, y, z = np.indices((8, 8, 8)) | |
| # draw cuboids in the top left and bottom right corners, and a link between them | |
| cube1 = (x < 3) & (y < 3) & (z < 3) | |
| cube2 = (x >= 5) & (y >= 5) & (z >= 5) | |
| link = abs(x - y) + abs(y - z) + abs(z - x) <= 2 | |
| # combine the objects into a single boolean array | |
| voxels = cube1 | cube2 | link | |
| colors = np.empty(voxels.shape, dtype=object) | |
| colors[link] = 'red' | |
| colors[cube1] = 'blue' | |
| colors[cube2] = 'green' | |
| return voxels, colors | |
| voxels, colors = generate_data() | |
| # let's put sliders to modify view init, each time you move that the script is rerun, but voxels are not regenerated | |
| # TODO : not sure that's the most optimized way to rotate axis but well, demo purpose | |
| azim = st.sidebar.slider("azim", 0, 90, 30, 1) | |
| elev = st.sidebar.slider("elev", 0, 360, 240, 1) | |
| # and plot everything | |
| fig = plt.figure() | |
| ax = fig.gca(projection='3d') | |
| ax.voxels(voxels, facecolors=colors, edgecolor='k') | |
| ax.view_init(azim, elev) | |
| st.pyplot(fig) | |
Author
asehmi
commented
Apr 19, 2022
Sign up for free
to join this conversation on GitHub.
Already have an account?
Sign in to comment