Created
February 22, 2020 22:51
-
-
Save baptiste/586c9ca37e329fd23555ee14f31adb25 to your computer and use it in GitHub Desktop.
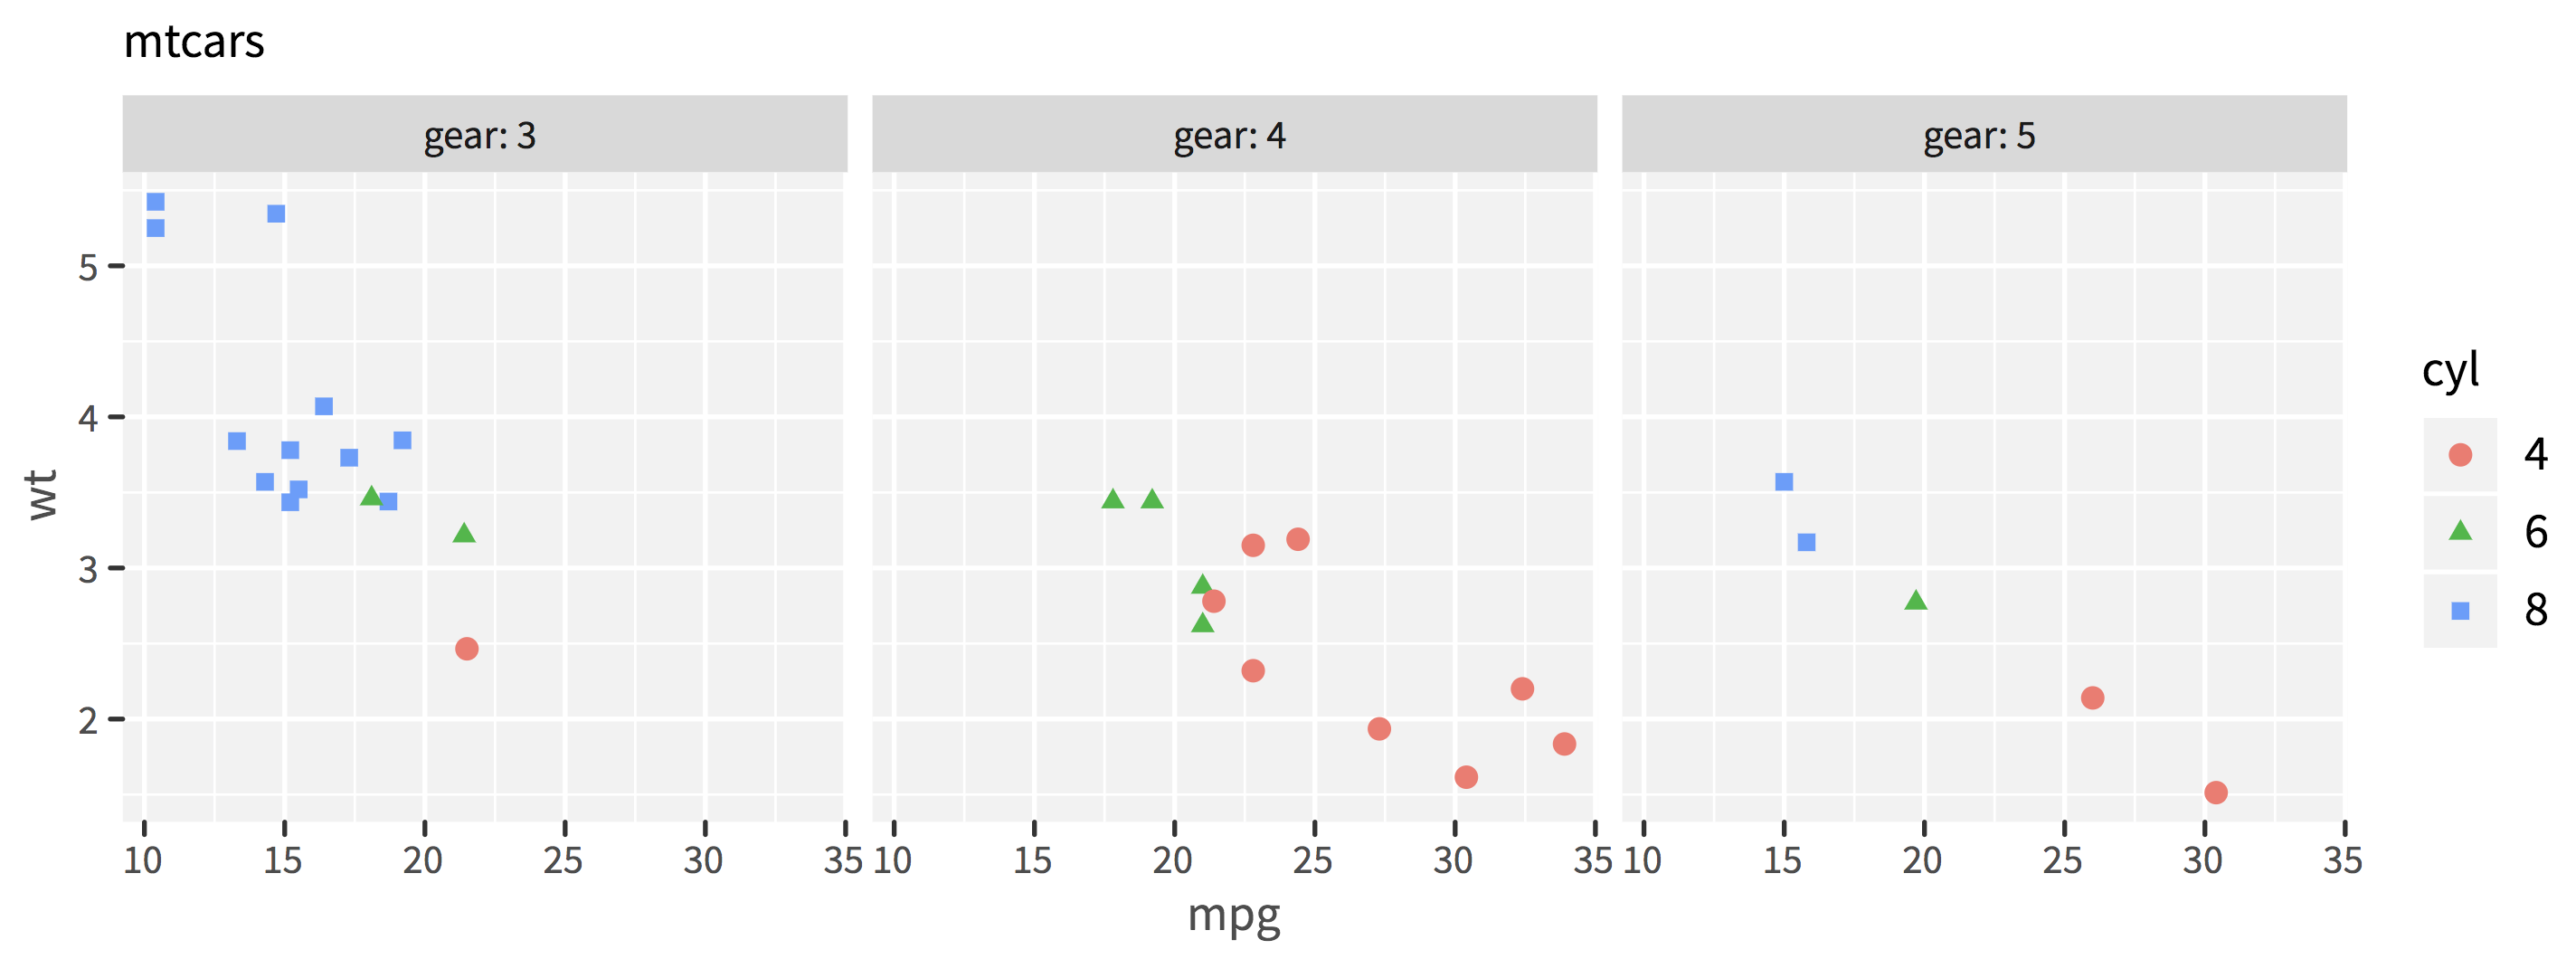
hand-crafted hard-coded ggplot
This file contains hidden or bidirectional Unicode text that may be interpreted or compiled differently than what appears below. To review, open the file in an editor that reveals hidden Unicode characters.
Learn more about bidirectional Unicode characters
| library(glue) | |
| make_header <- function(css = 'svg.css') | |
| glue( | |
| '<?xml version="1.0" encoding="utf-8"?> | |
| <?xml-stylesheet type="text/css" href="{css}"?> | |
| <svg viewBox="0 0 576 216" xmlns="http://www.w3.org/2000/svg" xmlns:xlink="http://www.w3.org/1999/xlink">', css = css) | |
| make_defs <- function() | |
| ' | |
| <defs> | |
| <clipPath id="clip_plot"> | |
| <rect x="0" y="0" width="576" height="216" /> | |
| </clipPath> | |
| <clipPath id="clip_panel1"> | |
| <rect x="20" y="20" width="200" height="200" /> | |
| </clipPath> | |
| <clipPath id="clip_panel2"> | |
| <rect x="194.39" y="40.38" width="160.54" height="143.87" /> | |
| </clipPath> | |
| <clipPath id="clip_panel3"> | |
| <rect x="360.41" y="40.38" width="160.54" height="143.87" /> | |
| </clipPath> | |
| <clipPath id="clip_strip1"> | |
| <rect x="28.37" y="23.35" width="160.54" height="17.03" /> | |
| </clipPath> | |
| <clipPath id="clip_strip2"> | |
| <rect x="194.39" y="23.35" width="160.54" height="17.03" /> | |
| </clipPath> | |
| <clipPath id="clip_strip3"> | |
| <rect x="360.41" y="23.35" width="160.54" height="17.03" /> | |
| </clipPath> | |
| </defs> | |
| ' | |
| make_plot <- function() | |
| ' | |
| <rect class = "plot_bg" x="0" y="0" width="576" height="216" /> | |
| ' | |
| make_panel <- function() | |
| ' | |
| <rect class="panel_bg" clip-path="url(#clip_panel1)" x="28.37" y="40.38" width="160.54" height="143.87" /> | |
| <rect clip-path="url(#clip_panel2)" x="194.39" y="40.38" width="160.54" height="143.87" class="panel_bg" /> | |
| <rect clip-path="url(#clip_panel3)" x="360.41" y="40.38" width="160.54" height="143.87" class="panel_bg" /> | |
| ' | |
| make_gridlines <- function() | |
| ' | |
| <g clip-path="url(#clip_panel1)" > | |
| <polyline points="28.37,178.15 188.91,178.15" class = "grid_minor"/> | |
| <polyline points="28.37,144.71 188.91,144.71" class = "grid_minor" /> | |
| <polyline points="28.37,111.27 188.91,111.27" class = "grid_minor" /> | |
| <polyline points="28.37,77.82 188.91,77.82" class = "grid_minor" /> | |
| <polyline points="28.37,44.38 188.91,44.38" class = "grid_minor" /> | |
| <polyline points="48.71,184.26 48.71,40.38" class = "grid_minor" /> | |
| <polyline points="79.76,184.26 79.76,40.38" class = "grid_minor" /> | |
| <polyline points="110.82,184.26 110.82,40.38" class = "grid_minor" /> | |
| <polyline points="141.87,184.26 141.87,40.38" class = "grid_minor" /> | |
| <polyline points="172.92,184.26 172.92,40.38" class = "grid_minor" /> | |
| <polyline points="28.37,161.43 188.91,161.43" class = "grid_major" /> | |
| <polyline points="28.37,127.99 188.91,127.99" class = "grid_major" /> | |
| <polyline points="28.37,94.54 188.91,94.54" class = "grid_major" /> | |
| <polyline points="28.37,61.1 188.91,61.1" class = "grid_major" /> | |
| <polyline points="33.18,184.26 33.18,40.38" class = "grid_major" /> | |
| <polyline points="64.24,184.26 64.24,40.38" class = "grid_major" /> | |
| <polyline points="95.29,184.26 95.29,40.38" class = "grid_major" /> | |
| <polyline points="126.34,184.26 126.34,40.38" class = "grid_major" /> | |
| <polyline points="157.39,184.26 157.39,40.38" class = "grid_major" /> | |
| <polyline points="188.45,184.26 188.45,40.38" class = "grid_major" /> | |
| </g> | |
| <g clip-path="url(#clip_panel2)" > | |
| <polyline points="194.39,178.15 354.93,178.15" class = "grid_minor" /> | |
| <polyline points="194.39,144.71 354.93,144.71" class = "grid_minor" /> | |
| <polyline points="194.39,111.27 354.93,111.27" class = "grid_minor" /> | |
| <polyline points="194.39,77.82 354.93,77.82" class = "grid_minor" /> | |
| <polyline points="194.39,44.38 354.93,44.38" class = "grid_minor" /> | |
| <polyline points="214.73,184.26 214.73,40.38" class = "grid_minor" /> | |
| <polyline points="245.78,184.26 245.78,40.38" class = "grid_minor" /> | |
| <polyline points="276.83,184.26 276.83,40.38" class = "grid_minor" /> | |
| <polyline points="307.89,184.26 307.89,40.38" class = "grid_minor" /> | |
| <polyline points="338.94,184.26 338.94,40.38" class = "grid_minor" /> | |
| <polyline points="194.39,161.43 354.93,161.43" class = "grid_major" /> | |
| <polyline points="194.39,127.99 354.93,127.99" class = "grid_major" /> | |
| <polyline points="194.39,94.54 354.93,94.54" class = "grid_major" /> | |
| <polyline points="194.39,61.1 354.93,61.1" class = "grid_major" /> | |
| <polyline points="199.2,184.26 199.2,40.38" class = "grid_major" /> | |
| <polyline points="230.26,184.26 230.26,40.38" class = "grid_major" /> | |
| <polyline points="261.31,184.26 261.31,40.38" class = "grid_major" /> | |
| <polyline points="292.36,184.26 292.36,40.38" class = "grid_major" /> | |
| <polyline points="323.41,184.26 323.41,40.38" class = "grid_major" /> | |
| <polyline points="354.47,184.26 354.47,40.38" class = "grid_major" /> | |
| </g> | |
| <g clip-path="url(#clip_panel3)" > | |
| <polyline points="360.41,178.15 520.95,178.15" class = "grid_minor" /> | |
| <polyline points="360.41,144.71 520.95,144.71" class = "grid_minor" /> | |
| <polyline points="360.41,111.27 520.95,111.27" class = "grid_minor" /> | |
| <polyline points="360.41,77.82 520.95,77.82" class = "grid_minor" /> | |
| <polyline points="360.41,44.38 520.95,44.38" class = "grid_minor" /> | |
| <polyline points="380.75,184.26 380.75,40.38" class = "grid_minor" /> | |
| <polyline points="411.8,184.26 411.8,40.38" class = "grid_minor" /> | |
| <polyline points="442.85,184.26 442.85,40.38" class = "grid_minor" /> | |
| <polyline points="473.91,184.26 473.91,40.38" class = "grid_minor" /> | |
| <polyline points="504.96,184.26 504.96,40.38" class = "grid_minor" /> | |
| <polyline points="360.41,161.43 520.95,161.43" class = "grid_major" /> | |
| <polyline points="360.41,127.99 520.95,127.99" class = "grid_major" /> | |
| <polyline points="360.41,94.54 520.95,94.54" class = "grid_major" /> | |
| <polyline points="360.41,61.1 520.95,61.1" class = "grid_major" /> | |
| <polyline points="365.22,184.26 365.22,40.38" class = "grid_major" /> | |
| <polyline points="396.28,184.26 396.28,40.38" class = "grid_major" /> | |
| <polyline points="427.33,184.26 427.33,40.38" class = "grid_major" /> | |
| <polyline points="458.38,184.26 458.38,40.38" class = "grid_major" /> | |
| <polyline points="489.43,184.26 489.43,40.38" class = "grid_major" /> | |
| <polyline points="520.49,184.26 520.49,40.38" class = "grid_major" /> | |
| </g> | |
| ' | |
| make_layer_points <- function(){ | |
| ' | |
| <g clip-path="url(#clip_panel1)" > | |
| <polygon points="103.98,117.76 106.62,122.32 101.35,122.32" style="fill: #00BA38; stroke: none" /> | |
| <polygon points="85.26,115.23 89.17,115.23 89.17,111.32 85.26,111.32" style="fill: #619CFF; stroke: none" /> | |
| <polygon points="83.49,109.56 86.12,114.12 80.86,114.12" style="fill: #00BA38; stroke: none" /> | |
| <polygon points="57.93,110.88 61.84,110.88 61.84,106.97 57.93,106.97" style="fill: #619CFF; stroke: none" /> | |
| <polygon points="70.98,94.16 74.89,94.16 74.89,90.25 70.98,90.25" style="fill: #619CFF; stroke: none" /> | |
| <polygon points="76.57,105.53 80.48,105.53 80.48,101.62 76.57,101.62" style="fill: #619CFF; stroke: none" /> | |
| <polygon points="63.52,103.86 67.43,103.86 67.43,99.95 63.52,99.95" style="fill: #619CFF; stroke: none" /> | |
| <polygon points="33.71,54.7 37.62,54.7 37.62,50.79 33.71,50.79" style="fill: #619CFF; stroke: none" /> | |
| <polygon points="33.71,48.88 37.62,48.88 37.62,44.97 33.71,44.97" style="fill: #619CFF; stroke: none" /> | |
| <polygon points="60.42,51.52 64.33,51.52 64.33,47.61 60.42,47.61" style="fill: #619CFF; stroke: none" /> | |
| <circle style="fill: #F8766D; stroke: none" cx="104.6" cy="145.88" r="1.95pt" /> | |
| <polygon points="65.39,112.55 69.3,112.55 69.3,108.64 65.39,108.64" style="fill: #619CFF; stroke: none" /> | |
| <polygon points="63.52,115.39 67.43,115.39 67.43,111.48 63.52,111.48" style="fill: #619CFF; stroke: none" /> | |
| <polygon points="51.72,101.85 55.63,101.85 55.63,97.94 51.72,97.94" style="fill: #619CFF; stroke: none" /> | |
| <polygon points="88.37,101.68 92.28,101.68 92.28,97.77 88.37,97.77" style="fill: #619CFF; stroke: none" /> | |
| </g> | |
| <g clip-path="url(#clip_panel2)" > | |
| <polygon points="267.52,137.65 270.15,142.21 264.89,142.21" style="fill: #00BA38; stroke: none" /> | |
| <polygon points="267.52,129.13 270.15,133.69 264.89,133.69" style="fill: #00BA38; stroke: none" /> | |
| <circle style="fill: #F8766D; stroke: none" cx="278.7" cy="150.73" r="1.95pt" /> | |
| <circle style="fill: #F8766D; stroke: none" cx="288.63" cy="121.63" r="1.95pt" /> | |
| <circle style="fill: #F8766D; stroke: none" cx="278.7" cy="122.97" r="1.95pt" /> | |
| <polygon points="256.34,110.23 258.97,114.79 253.71,114.79" style="fill: #00BA38; stroke: none" /> | |
| <polygon points="247.65,110.23 250.28,114.79 245.01,114.79" style="fill: #00BA38; stroke: none" /> | |
| <circle style="fill: #F8766D; stroke: none" cx="338.32" cy="154.74" r="1.95pt" /> | |
| <circle style="fill: #F8766D; stroke: none" cx="325.9" cy="174.3" r="1.95pt" /> | |
| <circle style="fill: #F8766D; stroke: none" cx="347.63" cy="166.95" r="1.95pt" /> | |
| <circle style="fill: #F8766D; stroke: none" cx="306.64" cy="163.6" r="1.95pt" /> | |
| <circle style="fill: #F8766D; stroke: none" cx="270" cy="135.34" r="1.95pt" /> | |
| </g> | |
| <g clip-path="url(#clip_panel3)" > | |
| <circle style="fill: #F8766D; stroke: none" cx="464.59" cy="156.75" r="1.95pt" /> | |
| <circle style="fill: #F8766D; stroke: none" cx="491.92" cy="177.72" r="1.95pt" /> | |
| <polygon points="399.29,124.26 403.2,124.26 403.2,120.35 399.29,120.35" style="fill: #619CFF; stroke: none" /> | |
| <polygon points="425.47,132.64 428.1,137.2 422.83,137.2" style="fill: #00BA38; stroke: none" /> | |
| <polygon points="394.32,110.88 398.23,110.88 398.23,106.97 394.32,106.97" style="fill: #619CFF; stroke: none" /> | |
| </g> | |
| ' | |
| } | |
| make_strip <- function() | |
| ' | |
| <g clip-path="url(#clip_strip1)"> | |
| <rect class = "strip_bg" x="28.37" y="23.35" width="160.54" height="17.03" /> | |
| <text class = "strip_fg" x="94.95" y="35.02" > | |
| gear: 3 | |
| </text> | |
| </g> | |
| <g clip-path="url(#clip_strip2)"> | |
| <rect class = "strip_bg" x="194.39" y="23.35" width="160.54" height="17.03" /> | |
| <text class = "strip_fg" x="260.97" y="35.02" > | |
| gear: 4 | |
| </text> | |
| </g> | |
| <g clip-path="url(#clip_strip3)"> | |
| <rect class = "strip_bg" x="360.41" y="23.35" width="160.54" height="17.03" /> | |
| <text class = "strip_fg" x="426.99" y="35.02" > | |
| gear: 5 | |
| </text> | |
| </g> | |
| ' | |
| make_ticks <- function() | |
| ' | |
| <g clip-path="url(#clip_plot)"> | |
| <polyline class = "ticks" points="25.63,161.43 28.37,161.43" /> | |
| <polyline class = "ticks" points="25.63,127.99 28.37,127.99" /> | |
| <polyline class = "ticks" points="25.63,94.54 28.37,94.54" /> | |
| <polyline class = "ticks" points="25.63,61.1 28.37,61.1" /> | |
| </g> | |
| <g clip-path="url(#clip_plot)"> | |
| <polyline class = "ticks" points="33.18,187 33.18,184.26"/> | |
| <polyline class = "ticks" points="64.24,187 64.24,184.26" /> | |
| <polyline class = "ticks" points="95.29,187 95.29,184.26" /> | |
| <polyline class = "ticks" points="126.34,187 126.34,184.26" /> | |
| <polyline class = "ticks" points="157.39,187 157.39,184.26" /> | |
| <polyline class = "ticks" points="188.45,187 188.45,184.26" /> | |
| </g> | |
| <g clip-path="url(#clip_plot)"> | |
| <polyline class = "ticks" points="199.2,187 199.2,184.26" /> | |
| <polyline class = "ticks" points="230.26,187 230.26,184.26" /> | |
| <polyline class = "ticks" points="261.31,187 261.31,184.26" /> | |
| <polyline class = "ticks" points="292.36,187 292.36,184.26" /> | |
| <polyline class = "ticks" points="323.41,187 323.41,184.26" /> | |
| <polyline class = "ticks" points="354.47,187 354.47,184.26" /> | |
| </g> | |
| <g clip-path="url(#clip_plot)"> | |
| <polyline class = "ticks" points="365.22,187 365.22,184.26" /> | |
| <polyline class = "ticks" points="396.28,187 396.28,184.26" /> | |
| <polyline class = "ticks" points="427.33,187 427.33,184.26" /> | |
| <polyline class = "ticks" points="458.38,187 458.38,184.26" /> | |
| <polyline class = "ticks" points="489.43,187 489.43,184.26" /> | |
| <polyline class = "ticks" points="520.49,187 520.49,184.26" /> | |
| </g> | |
| ' | |
| make_labels <- function() | |
| ' | |
| <g clip-path="url(#clip_plot)"> | |
| <text class = "axis_label" x="28.29" y="195.5" > | |
| 10 | |
| </text> | |
| <text class = "axis_label" x="59.34" y="195.5" > | |
| 15 | |
| </text> | |
| <text class = "axis_label" x="90.4" y="195.5" > | |
| 20 | |
| </text> | |
| <text class = "axis_label" x="121.45" y="195.5" > | |
| 25 | |
| </text> | |
| <text class = "axis_label" x="152.5" y="195.5" > | |
| 30 | |
| </text> | |
| <text class = "axis_label" x="183.55" y="195.5" > | |
| 35 | |
| </text> | |
| </g> | |
| <g clip-path="url(#clip_plot)"> | |
| <text class = "axis_label" x="194.31" y="195.5" > | |
| 10 | |
| </text> | |
| <text class = "axis_label" x="225.36" y="195.5" > | |
| 15 | |
| </text> | |
| <text class = "axis_label" x="256.42" y="195.5" > | |
| 20 | |
| </text> | |
| <text class = "axis_label" x="287.47" y="195.5" > | |
| 25 | |
| </text> | |
| <text class = "axis_label" x="318.52" y="195.5" > | |
| 30 | |
| </text> | |
| <text class = "axis_label" x="349.57" y="195.5" > | |
| 35 | |
| </text> | |
| </g> | |
| <g clip-path="url(#clip_plot)"> | |
| <text class = "axis_label" x="360.33" y="195.5" > | |
| 10 | |
| </text> | |
| <text class = "axis_label" x="391.38" y="195.5" > | |
| 15 | |
| </text> | |
| <text class = "axis_label" x="422.44" y="195.5" > | |
| 20 | |
| </text> | |
| <text class = "axis_label" x="453.49" y="195.5" > | |
| 25 | |
| </text> | |
| <text class = "axis_label" x="484.54" y="195.5" > | |
| 30 | |
| </text> | |
| <text class = "axis_label" x="515.59" y="195.5" > | |
| 35 | |
| </text> | |
| </g> | |
| <g clip-path="url(#clip_plot)"> | |
| <text class = "axis_label" x="18.55" y="164.59" > | |
| 2 | |
| </text> | |
| <text class = "axis_label" x="18.55" y="131.14" > | |
| 3 | |
| </text> | |
| <text class = "axis_label" x="18.55" y="97.7" > | |
| 4 | |
| </text> | |
| <text class = "axis_label" x="18.55" y="64.26" > | |
| 5 | |
| </text> | |
| </g> | |
| ' | |
| make_titles <- function() | |
| ' | |
| <text class = "axis_title" style="" x="263.96" y="208.08" clip-path="url(#clip_plot)"> | |
| mpg | |
| </text> | |
| <text class = "axis_title" style="" x="13.37" y="117.82" transform="rotate(-90 13.37 117.82)" clip-path="url(#clip_plot)"> | |
| wt | |
| </text> | |
| <g clip-path="url(#clip_plot)"> | |
| <text x="28.37" y="14.95" > | |
| mtcars | |
| </text> | |
| </g> | |
| ' | |
| make_guides <- function() | |
| ' | |
| <g clip-path="url(#clip_plot)"> | |
| <rect class = "guide_box" x="531.91" y="73.02" width="38.61" height="78.61" /> | |
| <text style="" x="537.39" y="87.6" > | |
| cyl | |
| </text> | |
| </g> | |
| <g clip-path="url(#clip_plot)"> | |
| <rect class = "guide_bg" x="537.39" y="94.3" width="17.28" height="17.28" /> | |
| <circle style="fill: #F8766D; stroke: none" cx="546.03" cy="102.94" r="1.95pt" /> | |
| <rect class = "guide_bg" clip-path="url(#clip_plot)" x="537.39" y="111.58" width="17.28" height="17.28" /> | |
| <polygon points="546.03,117.18 548.66,121.74 543.4,121.74" style="fill: #00BA38; stroke: none" /> | |
| <rect class = "guide_bg" x="537.39" y="128.86" width="17.28" height="17.28" /> | |
| <polygon points="544.07,139.46 547.98,139.46 547.98,135.55 544.07,135.55" style="fill: #619CFF; stroke: none" /> | |
| </g> | |
| <g clip-path="url(#clip_plot)"> | |
| <text class = "guide_fg" x="560.15" y="106.1" > | |
| 4 | |
| </text> | |
| <text class = "guide_fg" x="560.15" y="123.38" > | |
| 6 | |
| </text> | |
| <text class = "guide_fg" x="560.15" y="140.66" > | |
| 8 | |
| </text> | |
| </g> | |
| ' | |
| cat(make_header(), | |
| make_defs(), | |
| make_plot(), | |
| make_panel(), | |
| make_gridlines(), | |
| make_layer_points(), | |
| make_strip(), | |
| make_ticks(), | |
| make_labels(), | |
| make_titles(), | |
| make_guides(), | |
| '</svg>', sep='\n',file = 'testcraft.svg') | |
This file contains hidden or bidirectional Unicode text that may be interpreted or compiled differently than what appears below. To review, open the file in an editor that reveals hidden Unicode characters.
Learn more about bidirectional Unicode characters
| line, polyline, polygon, path, rect, circle { | |
| fill: red; | |
| stroke: #000000; | |
| stroke-width: 1.0; | |
| stroke-linecap: round; | |
| stroke-linejoin: round; | |
| stroke-miterlimit: 10.00; | |
| } | |
| text { | |
| font-family: Source Sans Pro, Helvetica, sans-serif; | |
| font-size: 11px; | |
| } | |
| rect.plot_bg { | |
| fill: none; | |
| stroke: white; | |
| } | |
| rect.panel_bg { | |
| fill: #EBEBEBAA; | |
| stroke: white; | |
| stroke-width: 0.1; | |
| } | |
| rect.strip_bg { | |
| fill: #D9D9D9; | |
| stroke: none; | |
| } | |
| polyline.grid_major { | |
| stroke: white; | |
| stroke-width: 1.07 | |
| } | |
| polyline.grid_minor { | |
| stroke: white; | |
| stroke-width: 0.53 | |
| } | |
| polyline.ticks { | |
| stroke: #333333; | |
| stroke-width: 1.07 | |
| } | |
| text.axis_label { | |
| font-family: Source Sans Pro; | |
| font-size: 9px; | |
| fill: #4D4D4D | |
| } | |
| text.axis_title { | |
| fill: #4D4D4D; | |
| } | |
| text.plot_title { | |
| fill: #4D4D4D; | |
| font-size: 13pt; | |
| } | |
| text.strip_fg { | |
| font-size: 9px; | |
| fill: #1A1A1A | |
| } | |
| rect.guide_box { | |
| fill: none; | |
| stroke: none; | |
| } | |
| rect.guide_bg { | |
| fill: #F2F2F2; | |
| stroke: #FFFFFF; | |
| stroke-width: 1.0; | |
| } | |
| rect.guide_fg { | |
| font-size: 9px; | |
| fill: #1A1A1A | |
| } |
Sign up for free
to join this conversation on GitHub.
Already have an account?
Sign in to comment
Preview (with css)