Canvas Math [🌱]
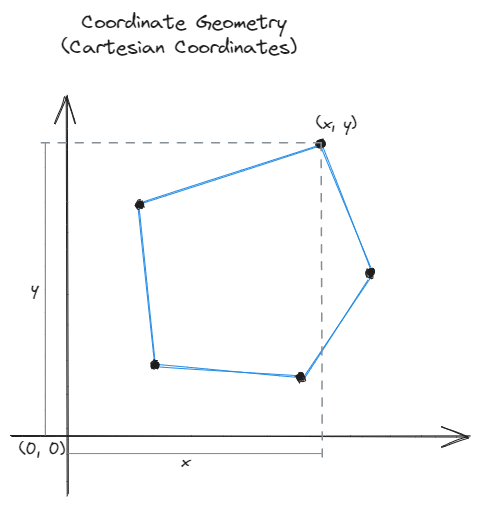
Allows you to plot a point based on it's distance from the origin. Points are expressed as
Allows you to plot a point based on its distance and angle from a center point. Points are expressed as
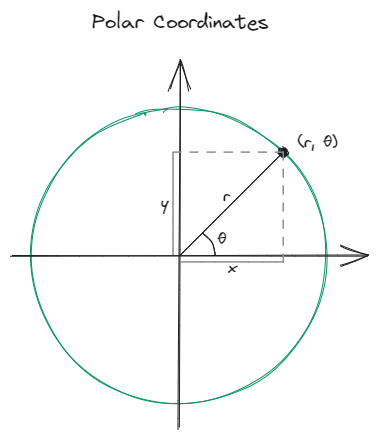
It is usually easier to think about a shape in polar coordinates and then convert it to Cartesian when are visualizing it.
For regular polygons, all points can be located on a circle. And all slices are symmetrical, which means that the angles can be calculated using:
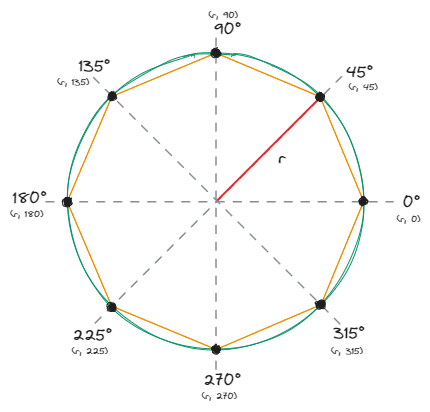
So, if we know
When going between the two, the conversions to go between radians and degrees is also necessary.
const radians = degree => degree * Math.PI / 180;const degrees = radians => radians * 180 / Math.PI;In order to convert to Polar from Cartesian, we need to find the radius
const round = (number, decimals = 5) =>
  Math.round(number * Math.pow(10, decimals)) / Math.pow(10, decimals);

const degrees = radians => radians * 180 / Math.PI;
const radius = (x, y) => Math.sqrt(Math.pow(x, 2) + Math.pow(y, 2));

// To ensure that the angle theta is between 0 and 2π (0 to 360 degrees),
// we add 2π to the angle if it's negative. This step makes sure the angle
// is measured counterclockwise from the positive x-axis.
const theta = (x, y) => {
  const theta =  Math.atan2(y, x);
  return theta < 0 ? degrees(theta + 2 * Math.PI) : degrees(theta);
}

const cartesianToPolar = (x, y) => [
  radius(x, y),
  round(theta(x, y), 1),
];const round = (number, decimals = 5) =>
Math.round(number * Math.pow(10, decimals)) / Math.pow(10, decimals);
const radians = degree => degree * Math.PI / 180;
const x = (radius, radian) => radius * Math.cos(radian);
const y = (radius, radian) => radius * Math.sin(radian);
const polarToCart = (radius, degree) => [
round(x(radius, radians(degree)), 2),
round(y(radius, radians(degree)), 2)
];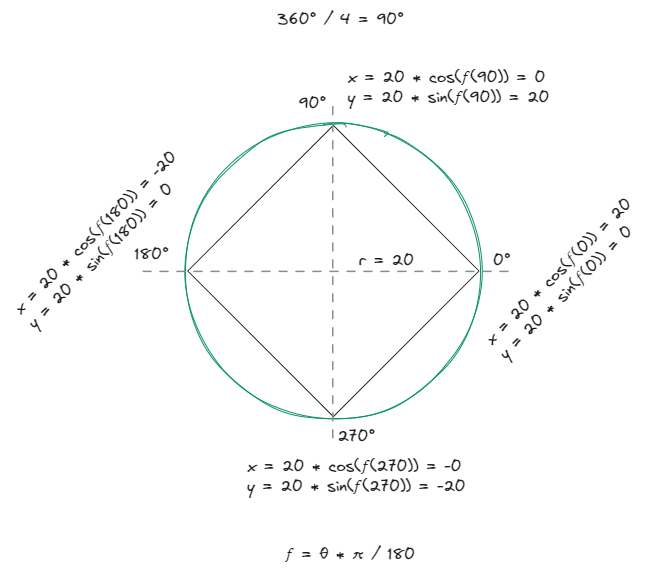
For the above, we get:
polarToCart(20, 0); // [20, 0]
polarToCart(20, 90); // [0, 20]
polarToCart(20, 180); // [-20, 0]
polarToCart(20, 270); // [-0, -20]