
For an individual x and a mutation rate m, sample a normally distributed random variable with a mean of 0 and a standard deviation of m, then add the sampled value to x.
Use this new mutation operator to create Generation 2, using 0.80070853 as the parent and a mutation rate of 100.
Sure thing. Here is the list of 30 mutated children, generated using the parent 0.80070853 and a mutation rate of 100:
[180.80709, -17.19291, 178.88452, -48.57673, 278.6813, -47.19802, 278.14084, -759.4385, -721.0789, 278.80071, 378.63885, 278.29783, 378.58075, 378.98019, 379.80915, -80.49932, -48.20631, 278.88444, 378.69139, -78.23594, -733.3278, 178.96206, 153.65894, -77.69076, -741.6512, 153.19502, 253.89325, -72.34335, 379.88691, -50.4391]
To perform this analysis, each of the 30 children was subtracted from the parent, 0.80070853, to determine the random numbers that were sampled in order to perform each mutation.
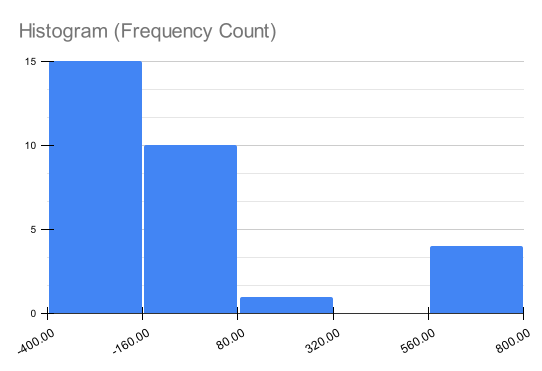
| Metric | Sample Result | Requested |
|---|---|---|
| Mean | -42.22977 | 0 |
| Std Dev | 353.36437 | 100 |
Shapiro-Wilk Normality Test
W = 0.789458509236057
Threshold (p=0.01) = 0.8999999 --> HO rejected
Threshold (p=0.05) = 0.9269999 --> HO rejected
Threshold (p=0.10) = 0.9390000 --> HO rejected
--> Your data is not normally distributed p<0.01

Uploading SVG image here in the comments for inclusion in the .md file: