Last active
March 24, 2023 17:53
-
-
Save benmarwick/f3e0cafe668f3d6ff6e5 to your computer and use it in GitHub Desktop.
Auto-numbering and cross-referencing of figures and tables in rmarkdown
This file contains hidden or bidirectional Unicode text that may be interpreted or compiled differently than what appears below. To review, open the file in an editor that reveals hidden Unicode characters.
Learn more about bidirectional Unicode characters
| --- | |
| title: "Auto-numbering and cross-referencing of figures and tables in rmarkdown" | |
| output: html_document | |
| --- | |
| NOTE: I recommend using the bookdown package and `output: html_document2` to make captions and cross-references more easily than the method described below. | |
| TODO: check this out: https://github.com/adletaw/captioner | |
| Here's how to use: | |
| 1. Copy and paste the first two code chunks in this document to the top of your document | |
| 2. Make sure you have knitr and kfigr installed, use `devtools::install_github("github mkoohafkan/kfigr")` to install kfigr | |
| 3. For chunks in your doc that produce a figure or table for which you want a caption, be sure to include a label in the chuck options line. For example, the first chunk is this doc has the label `number_figures` | |
| 4. Also in the chunk options line, you need to specify the anchor type and the caption, for example `anchor="figure", fig.cap="Here is a nice figure"`, see the examples below. That will auto-generate the caption and give you auto-numering. See the example below for using with tables. | |
| 5. When you want to refer to the figure or table in your text, use a bit of in-line code like so `r figr('my-label', TRUE, type="figure")` which will generate a cross-reference like 'figure 3' or whatever the correct number is for the figure produced by the chunk that has the label 'my-label' | |
| 6. Other similar methods: | |
| - http://rmflight.github.io/posts/2012/10/papersinRmd.html & https://gist.github.com/rmflight/3858973 | |
| - http://galahad.well.ox.ac.uk/repro/ | |
| - http://gforge.se/2014/01/fast-track-publishing-using-knitr-part-iii/ | |
| ```{r number_figures, echo=FALSE} | |
| # This is a knitr hook to enable figure and table captions | |
| # number figures | |
| # from http://stackoverflow.com/a/18672268/1036500 | |
| library("knitr") | |
| tn = local({ | |
| i = 0 | |
| function(x) { | |
| i <<- i + 1 | |
| paste("<table><caption>", 'Figure ', i, ': ', x, "</caption><colgroup><col width='100'></col></colgroup><thead><tr class='header'></tr></thead><tbody></tbody></table><p>", sep = '') | |
| } | |
| }) | |
| knit_hooks$set(fig.cap = function(before, options, envir) { | |
| if(!before) | |
| tn(options$fig.cap) | |
| }) | |
| default_output_hook = knit_hooks$get("output") | |
| knit_hooks$set(output = function(x, options) { | |
| if (is.null(options$fig.cap) == F) | |
| x | |
| else | |
| default_output_hook(x,options) | |
| }) | |
| # number tables | |
| # from http://stackoverflow.com/a/18672268/1036500 | |
| to = local({ | |
| i = 0 | |
| function(x) { | |
| i <<- i + 1 | |
| paste("<table><caption>", 'Table ', i, ': ', x, "</caption><colgroup><col width='100'></col></colgroup><thead><tr class='header'></tr></thead><tbody></tbody></table><p>", sep = '') | |
| } | |
| }) | |
| knit_hooks$set(tab.cap = function(before, options, envir) { | |
| if(!before) | |
| to(options$tab.cap) | |
| }) | |
| default_output_hook = knit_hooks$get("output") | |
| knit_hooks$set(output = function(x, options) { | |
| if (is.null(options$tab.cap) == F) | |
| x | |
| else | |
| default_output_hook(x,options) | |
| }) | |
| ``` | |
| ```{r setup, echo=FALSE, message=FALSE} | |
| require(knitr) | |
| require(kfigr) # devtools::install_github("github mkoohafkan/kfigr") | |
| opts_chunk$set(message=FALSE, warning=FALSE) | |
| ``` | |
| # My document starts here | |
| We can embed plots, for example: | |
| ```{r first, anchor="figure", fig.cap="Rather small sample", fig.align='center'} | |
| require(ggplot2) | |
| qplot(rnorm(10), geom="histogram") | |
| ``` | |
| Note that for `r figr('first', TRUE, type="figure")` we can refer to the figure by the chunck label and that will generate an auto-numbered reference in the text that also links to the figure. | |
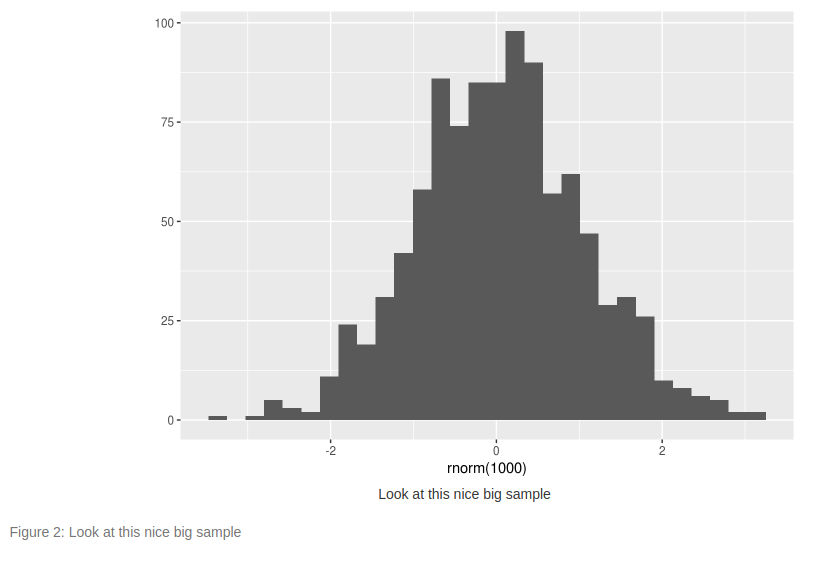
| ```{r second, anchor="figure", fig.cap="Look at this nice big sample", fig.align='center'} | |
| require(ggplot2) | |
| qplot(rnorm(1000), geom="histogram") | |
| ``` | |
| Note that for `r figr('second', TRUE, type="figure")` we can do the same thing, numbering is taken care of for us. | |
| ```{r mytable, anchor="table", tab.cap="my table about cars", tab.align='center'} | |
| kable(mtcars) | |
| ``` | |
| And we can have a table, see `r figr('mytable', TRUE, type="table")` we can refer to the table with a numbered reference in the text that also links to the table. | |
| We can refer to the figures and tables multiple times in the text with no problems: `r figr('first', TRUE, type="figure")`, `r figr('second', TRUE, type="figure")`, `r figr('mytable', TRUE, type="table")` | |
This is great. Thanks for the contribution!
For figures the title in fig.cap appears twice in the document:
I found an issue: if you add the following chunck to your document
summary(mtcars)
you get the following error
Error: C stack usage  7969380 is too close to the limit
Execution halted
I found this issue working on my own documents using your functions and took me a while to find this.
Sign up for free
to join this conversation on GitHub.
Already have an account?
Sign in to comment
This works great for me with word so far. Modified it so i get Figure S#. instead of figure #. However, in the in line text reference i get Figure S # instead of the desired Figure S#. How can i remove the space between S and # in the cross reference in the text? Thank you in advance for your help and contribution with this.