HTTP response 503 Service Unavailable from IIS: one common generic cause - Microsoft Community Hub
Published Sep 28 2020 06:07 AM 178K Views
TL;DR:
The 503 response from the IIS machine, Service Unavailable, is the result of repeated application crashes. Since the w3wp.exe worker process, created by IIS to execute a web application, is crashing frequently, the respective IIS application pool is turned off. This is a feature of IIS, at Application Pool level, called Rapid-Fail Protection. It helps prevent consuming valuable system resources creating a worker process that crashes anyway, soon after spawning.
- Evidence of repeated w3wp.exe crashes and Rapid-Fail Protection may be found in Windows Events, in the System log with Source=WAS.
- Evidence of what causes the w3wp.exe to crash may be found in Windows Events, in the Application log: second-chance crashing exceptions with w3wp.exe.
**Collecting the IIS basic troubleshooting info helps expedite investigation for the root cause of application crashes. Follow the steps at http://linqto.me/iis-basic-files for instructions.
In many cases, it may be needed to collect memory dumps to study the exceptions causing the crash: see article at http://linqto.me/dumps.
**
If we’re looking at the reference list of responses that IIS could send, an HTTP response status 503 means Service Unavailable. In most of the cases, we have a 503.0, Application pool unavailable; and when we check the corresponding application pool, it shows “Stopped”.
Believe it or not, that is actually a feature in IIS acting: the Rapid-Fail Protection. If the hosted application is causing the crash of its executing process for 5 times in less than 5 minutes, then the Application Pool is turned off automatically. These values are the default values; but you get the point.

But why turning off the application pool at all? Why is IIS doing that?
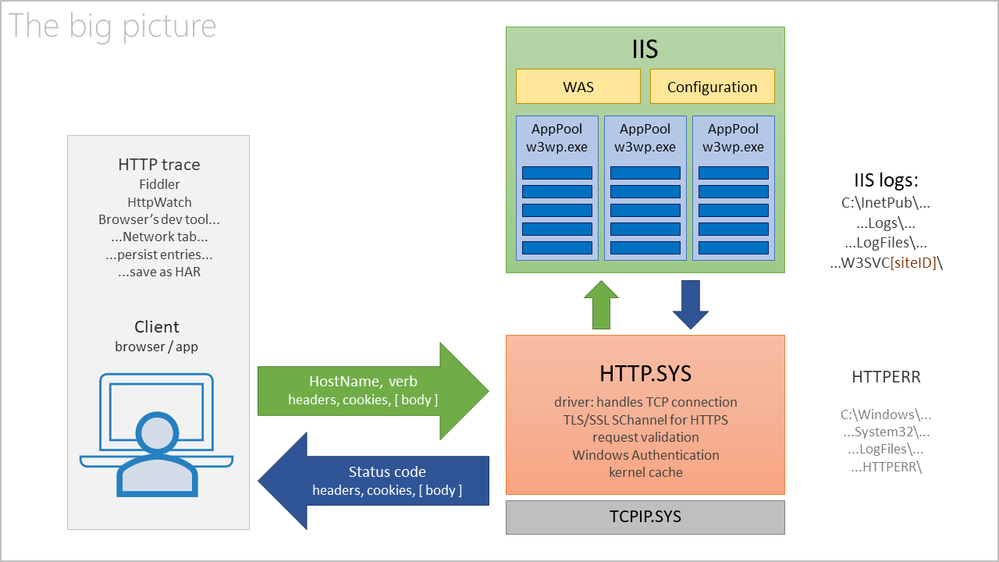
You see, there is an IIS component called WAS, Windows (Process) Activation Service, that is creating and then monitoring the worker processes – w3wp.exe – for application pools. These are the IIS processes that are loading and then executing the Web apps, including the Asp.Net ones. These are the processes responding to HTTP requests.
If a worker process crashes, WAS would immediately try to create a new process for the Application Pool; because the Web apps needs to continue serving requests. But if these processes are repeatedly crashing, soon after being created, WAS is going to “say”:
I keep creating processes for this app, and they crash. It is expensive for the system to create these processes, which crash anyway. So why don’t I stop doing that, marking the Application Pool accordingly (Stopped), until the administrator is fixing the cause. Once the condition causing the crashes is removed, then the administrator may manually re-Start the application pool.
This WAS is reporting stuff in Windows Events, in the System log. So, if we open the Events Viewer, go to System log and filter by Event Sources=WAS, we may see a pattern like this:

There is a pattern to look for: Usually 5 Warning events 5011, for same application pool name, within a short time frame; if the PIDs, Process ID, in the Warning events are changing, it is a sign that the previous w3wp.exe instance was “killed”, it ended for some reason:
A process serving application pool 'BuggyBits.local' suffered a fatal communication error with the Windows Process Activation Service. The process id was '6992'. The data field contains the error number.
... and then followed by an Error event 5002 for that same application pool name:
Application pool 'BuggyBits.local' is being automatically disabled due to a series of failures in the process(es) serving that application pool.
This behavior – turning off the application pool – is also seen when WAS can’t start the worker process at all. For instance when the application pool identity has a wrong or non-decipherable password: WAS can’t (repeatedly) start the w3wp.exe with the custom account that was set for the application pool. In Windows Events we would see Warnings/Errors from WAS like:
Event ID 5021 when IIS/WAS starts: The identity of application pool BuggyBits.local is invalid. The user name or password that is specified for the identity may be incorrect, or the user may not have batch logon rights. If the identity is not corrected, the application pool will be disabled when the application pool receives its first request. If batch logon rights are causing the problem, the identity in the IIS configuration store must be changed after rights have been granted before Windows Process Activation Service (WAS) can retry the logon. If the identity remains invalid after the first request for the application pool is processed, the application pool will be disabled. The data field contains the error number.
Event ID 5057 when app is first accessed: Application pool BuggyBits.local has been disabled. Windows Process Activation Service (WAS) did not create a worker process to serve the application pool because the application pool identity is invalid.
Event ID 5059, service becomes unavailable: Application pool BuggyBits.local has been disabled. Windows Process Activation Service (WAS) encountered a failure when it started a worker process to serve the application pool.
When the application pool is turned off, hence we don’t have a w3wp.exe to process on requests for it, we’re having the HTTP.SYS driver responding status 503 instead of IIS. Remember that IIS is just a user-mode service making use of the kernel-level HTTP.SYS driver?

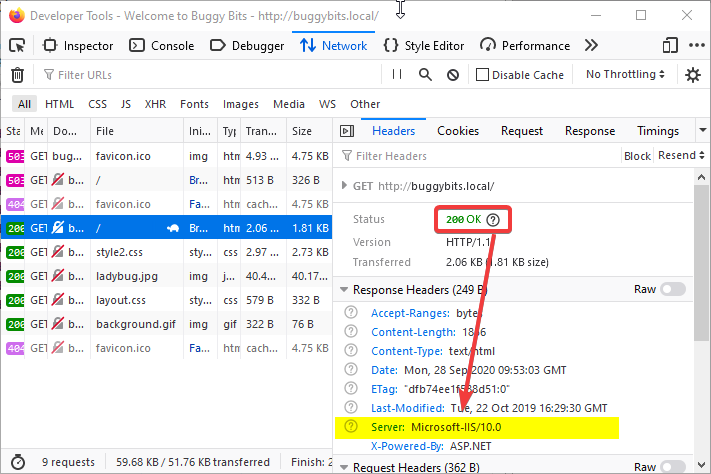
With a normal, successful request, we have the IIS responding:

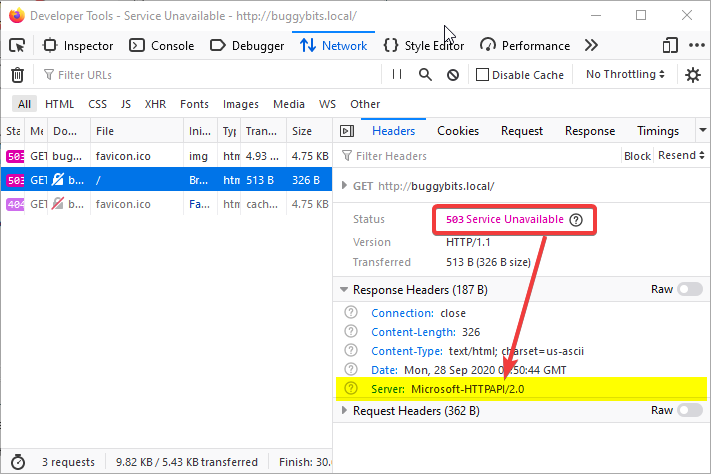
But when the application pool is down, the request does not even reach IIS. The response comes from HTTP.SYS, not from the w3wp.exe:

Without a w3wp.exe to process the requests which arrived for an application pool, HTTP.SYS, while acting as a proxy, basically says:
Look, dear client, I tried to relay your request to IIS, to its w3wp.exe process created to execute the called app.
But the app or its configuration is repeatedly crashing the worker process, so creation of new processes ceased.
Hence, I had no process where to relay your request; there is no service ready to process your request.
Sorry: 503, Service Unavailable.
I think of an IIS application pool as:
-
A queue for requests, in the kernel, maintained the HTTP.SYS driver; see it in a command-line console with
netsh http show servicestate
-
Settings on how to create a w3wp.exe IIS worker process and how it should behave.
- This process will load and execute our web application, most commonly an Asp.Net/NET Framework application.
As with all applications, exceptions happen, unforeseen errors. They all start as first-chance exceptions.
- Most of the first-chance exceptions are handled and they never hurt the app or its executing process.
They are handled either by the code of the application, or by the Asp.Net framework itself.- If the unhandled exception happens in the context of executing an HTTP request, the Asp.Net Framework will do its best to treat (handle) it by wrapping it and generating an error page, usually with an HTTP response status code of 500, Server-side execution error.
The exception that was not handled by the developer's code gets handled by the underlying framework.
- If the unhandled exception happens in the context of executing an HTTP request, the Asp.Net Framework will do its best to treat (handle) it by wrapping it and generating an error page, usually with an HTTP response status code of 500, Server-side execution error.
- Some exceptions are unhandled, not treated by any code in the process, so they become the so-called second-chance / process-crashing exceptions.
- When these happen, the operating system simply terminates the process that generated them; all the virtual memory of the process is flushed away into oblivion.
- Exceptions occurring outside the context of a request processing (such as during application startup) have more chances to become second-chance, crashing exception.
Fortunately, these exceptions – first-chance or second-chance – may leave traces. The first place to look at is in the Windows Events, Application log.
As an illustration, the code of my application running in the BuggyBits.local application pool generated the following:

Since the exception could not be handled by the Asp.Net, it immediately became a second-chance exception, causing Windows to terminate the w3wp.exe in the same second:

If you notice the time-stamp in the capture above, it corresponds to a Warning event from WAS in the System log, telling that the worker process did not respond (Img 2).
This response does not refer to the HTTP request/response; it refers to pings from WAS.
Remember that I said WAS is creating the worker processes, w3wp.exe, but also it monitors them. It has to know if the worker process is healthy, if it can still serve requests. Of course, WAS is not able to know everything about the health of a w3wp.exe; many things could go wrong with the code of our app. But at least it can send pings to that process.
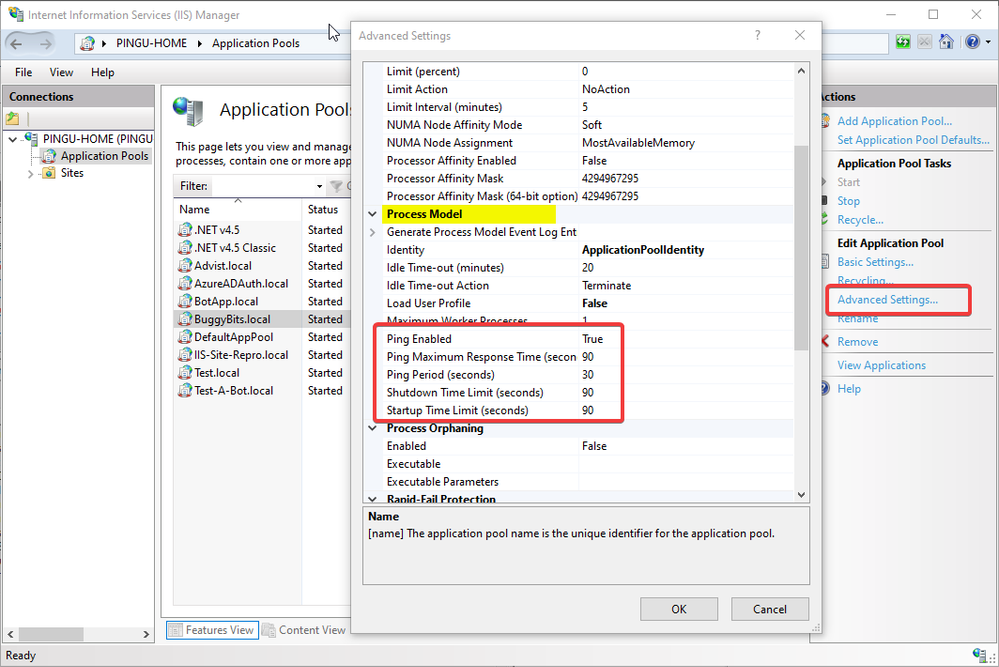
Illustrating with the Advanced Settings of an application pool, WAS is sending pings to its instances of w3wp.exe, every 30 seconds. For each ping, the w3wp.exe (that PID) has 90 seconds to respond. If no ping response is received, WAS concludes that the process is dead: a crash or hang happened – no process thread is available to respond to the ping. Notice that we also have other time limits too that WAS is looking on.

It may happen that, even looking in Windows Events > Application log, we still don’t know why our w3wp.exe is crashing or misbehaving. I’ve seen cases where the exceptions are not logged in Windows Events. In such cases, look in the custom logging solution of the web application, if it has one.
Lastly, if we don’t have a clue about these exceptions, if we have no traces left, we could attach a debugger to our w3wp.exe and see what kind of exceptions happen in there. Of course, we would need to reproduce the steps triggering the bad behavior, when using the debugger.
We can even tell that debugger to collect some more context around the exceptions, not just the exceptions itself. We could collect the call stacks or memory dumps for such context.
One such debugging tool is the command-line ProcDump. It does not require an installation; you only need to run it from an administrative console.
Let’s say I put my ProcDump in E:\Dumps\. Before using it, I must determine the PID, Process ID of my faulting worker process w3wp.exe:
E:\Dumps>C:\Windows\System32\InetSrv\appcmd.exe list wp
Then, I’m attaching ProcDump to the PID, redirecting its output to a file that I can later inspect:
E:\Dumps>procdump.exe -e 1 -f "" [PID-of-w3wp.exe] > ProcDump-monitoring-log.txt
If my Windows has an UI and I’m allowed to install diagnosing apps, then I prefer Debug Diagnostics. Its UI makes it easier to configure data collection, and it determines the PID of w3wp.exe itself, based on the app pool selected. Debug Diag is better suited to troubleshoot IIS applications.
Both Debug Diag and Proc Dump are free tools from Microsoft, widely used by professionals in troubleshooting. A lot of content is available on the Web on how to use these.
A natural continuation to this article is the one I wrote about exceptions, exception handling, and how to collect memory dumps to capture exceptions or performance issues:
Aside: Just in case you are wondering what I use to capture screenshots for illustrating my articles, check out this little ShareX application in Windows Store.