You signed in with another tab or window. Reload to refresh your session.You signed out in another tab or window. Reload to refresh your session.You switched accounts on another tab or window. Reload to refresh your session.Dismiss alert
Dances with Factors visualizes prime factorization of integers.
The fundamental theorem of arithmetic states that every integer greater than 1 is either prime itself or a product of prime numbers.
The project is created using D3.js.
Description
Dances with Factors is inspired by the creation of Stephen Von Worley, which in turn is based on the original idea by
Brent Yorgey. Use the control widgets to explore prime factorization of various numbers! You might be interested to check out some
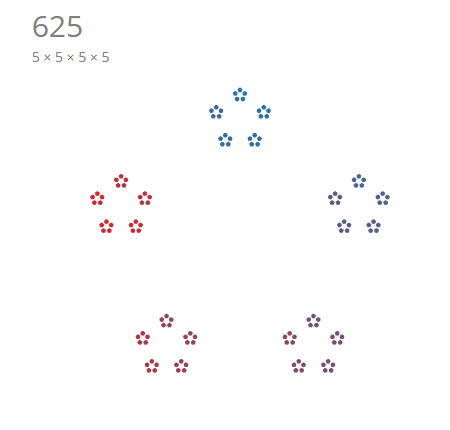
cool numbers e.g. 243, 611, 700, 1024 :)
This visualization helps us track the prime factors that compose a given number. We can easily identify primes when we arrive to a
simple circle (i.e. a prime cannot be composed of smaller divisors). We can also identify common patterns of smaller prime divisors
e.g. 2, 3, 5
An excellent implementation of prime factorization through SVG recursion is provided by Jason Davies. Instead of a recursive
approach, I decided to handle the problem through generating all relevant attributes of points i.e. x, y, and r. This allows me to
provide a data-driven solution to the problem and allow D3 to handle the transitions on new and old points.
Files
index.html: Main HTML file.
draw.js: All D3 drawing logic is contained in this file.
factor.js: JS file containing logic to compute factors and prime factorization of integers.
style.css: stylesheet
Other Notes
Visualizations at larger numbers become less visible due to a fixed viewing dimension and decreasing point radius.
This file contains hidden or bidirectional Unicode text that may be interpreted or compiled differently than what appears below. To review, open the file in an editor that reveals hidden Unicode characters.
Learn more about bidirectional Unicode characters
This file contains hidden or bidirectional Unicode text that may be interpreted or compiled differently than what appears below. To review, open the file in an editor that reveals hidden Unicode characters.
Learn more about bidirectional Unicode characters
This file contains hidden or bidirectional Unicode text that may be interpreted or compiled differently than what appears below. To review, open the file in an editor that reveals hidden Unicode characters.
Learn more about bidirectional Unicode characters
<i>Dances with Factors</i> is inspired by the creation of <a href="http://www.datapointed.net/visualizations/math/factorization/animated-diagrams/" target="_blank">Stephen Von Worley</a>, which in turn is based on the original idea by <a href="http://mathlesstraveled.com/2012/10/05/factorization-diagrams/"
target="_blank">Brent Yorgey</a>. Use the control widgets to explore prime factorization of various numbers! You might be interested to check out some cool numbers e.g. <code>243</code>, <code>611</code>, <code>700</code>, <code>1024</code> :)
</p>
<p>
This visualization helps us track the prime factors that compose a given number. We can easily identify primes when we arrive to a simple circle (i.e. a prime cannot be composed of smaller divisors). We can also identify common patterns of smaller prime
divisors e.g. <code>2</code>, <code>3</code>, <code>5</code>
</p>
<hr/>
<!-- implementation -->
<h2>Implementation</h2>
<p>
An excellent implementation of prime factorization through SVG recursion is provided by <a href="http://www.jasondavies.com/factorisation-diagrams/" target="_blank">Jason Davies</a>. Instead of a recursive approach, I decided to handle the problem
through generating all relevant attributes of points i.e. <code>x</code>, <code>y</code>, and <code>r</code>. This allows me to provide a data-driven solution to the problem and allow D3 to handle the transitions on new and old points.
</p>
<p>More details on code implementation and a guide can be found in the Github project page or on <a href="http://chrisrzhou.datanaut.io/">datanaut.io</a>
</p>
</div>
<!-- footer -->
<footer>
<p>
<a href="https://gist.github.com/chrisrzhou/3fec15b05684fa0cf42e" target="_blank">Dances with Factors</a> by
This file contains hidden or bidirectional Unicode text that may be interpreted or compiled differently than what appears below. To review, open the file in an editor that reveals hidden Unicode characters.
Learn more about bidirectional Unicode characters
Dances with Factors is inspired by the creation of Stephen Von Worley, which in turn is based on the original idea by Brent Yorgey.
This visualization helps us track the prime factorization of a number. We can easily identify primes when we arrive at a simple circle (i.e. a prime cannot be composed of smaller divisors). We can also identify common patterns of smaller prime divisors e.g. 2, 3, 5.
This tutorial will go into detail on the math and D3 logic used towards creating the interactive visualization. We will go over a few major topics:
Build mathematical factorization functions.
Generate unique drawing attributes (x, y, r) for each data point.
Visualize the data points with D3 functions.
Implement and isolateinit and update functions.
Extend visualization with interactive user widgets.
You can download the files used in this guide in the Github source code.
The fundamental theorem of arithmetic states that every integer greater than 1 is either prime itself or a product of prime numbers.
The fundamental theorem of arithemetic is the basis for this visualization. Given a number n, we are guaranteed an array of prime factors [p1, p2, p3, ... pn], which we use as a foundation for iteratively drawing subgroups of points in the visualization.
Prime factorization
Bulk of the prime factorization code was derived from a previous Python script that I worked on to solve mathematical problems on Project Euler. Porting the implementation to Javascript is fairly easy, and we will build two functions primeFactors and getFactor to generate all prime factors of an integer n in ascending order.
Here is the code for primeFactors:
/** * Return array of prime factors (in ascending order) of n. * * We will represent even powers of 2 as 4, for ease of plotting * * Examples: * primeFactors(1) = [] * primeFactors(10) = [2, 5] * primeFactors(5) = [5] */functionprimeFactors(n){if(n<1)throw"Argument error";varresult=[];while(n!=1){varfactor=getFactor(n);// call getFactor functionresult.push(factor);n/=factor;}returnresult;}
We start with a number n and assert that it is greater than 1.
Beginning with n, we will obtain the smallest prime factor of n with the helper function getFactor and assign it to factor.
Divide and update n by factor while collecting the factors in the array result.
Iteratively repeat the process until we arrive on the termination condition i.e. n = 1.
An example is provided below:
// example primeFactors(120) = [2, 2, 2, 3, 5]primeFactors(120)=[2,// getFactor(120) = 2, n updates to 602,// getFactor(60) = 2, n updates to 302,// getFactor(30) = 2, n updates to 153,// getFactor(15) = 3, n updates to 55,// getFactor(5) = 5, n updates to 1]
The implementation for the helper function getFactor is provided below:
/** * Return smallest prime factor of n. */functiongetFactor(n){if(n<2)throw"Argument error";if(n%2==0)return2;for(vari=3;i<=Math.floor(Math.sqrt(n));i+=2){if(n%i==0)returni;}returnn;}
We start with a number n and return 2 if n is even (since 2 is the smallest factor that divides an even number).
If n is odd, we iteratively check to see if it is divisible by i where i is incremented by 2.
Adjustments
We now have the math code that generates an array of prime factors for any integer n. However, we need to make a small output adjustment to the factors array to simplify subsequent D3 visualizations.
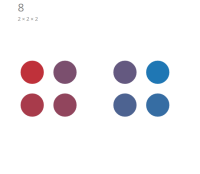
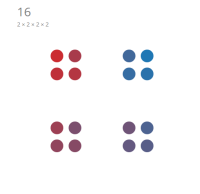
In particular, we wish to visualize groups of 2 and 4 differently. Take a look at the desired outputs of 8 and 16 shown below and notice how they are grouped differently.
We want to group points together in a square (4) rather than sets of pairs (2) whenever possible.
We can accomplish this grouping easily by "cheating" and assume that 4 is a unique "prime" which cannot be broken down into simpler representation of smaller primes.
Mathematically we know that this is not true, but this small change allows for a much simpler D3 visualization implementation since we can ignore special plotting cases for 2 and 4, and rely entirely on the geometry of angles to layout the points.
The code adjustment is as simple as adding a conditionalreturn statement in getFactor:
//function getFactor(n) {// if (n < 2) throw "Argument error";if(n%4==0)return4;// if (n % 2 == 0) return 2;// for (var i = 3; i <= Math.floor(Math.sqrt(n)); i += 2) {// if (n % i == 0) return i;// }// return n;//}
This prioritizes returning a factor of 4 whenever possible and returning 2 only when necessary. As a result, the outputs of primeFactors is now different. For the same example above:
Lastly, let's write a function that helps print out a string representation of our prime factors array. We will print "prime" when our factors array has only one element, and iteratively print out a concatenated string of factors otherwise.
If you have strong opinions to not alter the mathematical sanctity of prime factorization and prefer to delegate logic to their responsible areas, I'm definitely with you on that. But this is one simple tweak that would make our life a lot easier with D3 plotting, as we will now discuss in the next section.
Please refer to the draw.js file for function referenced throughout this section.
Jason Davies has implemented a recursive solution in D3 for this problem, which recursively calls the D3 draw function on subplots to rescale, transform and translate SVGs to achieve the desired visualization. His implementation is elegant and simple to understand, but has a slight drawback on restrictive animation of individual points and transitions.
I wanted to mimic the effect created by Stephen Von Worley, which means that I have to generate all the data and its attributes to allow D3 to work its transition magic on new and old data states.
The ultimate challenge with this approach is to implement a way to describe the geometry, position, size, and angles of all the points from an array of prime factors.
Generating points
In this section, I will assume complete implementation of D3 visualization components (described in the next section) in order to provide a basis to focus the discussion solely on pseudocode and design of the function generatePoints. generatePoints in turn guarantees a dataset of point objects that D3 can rely on for visualization.
The first thing before we start is to ask what does D3 fundamentally require to do its job?
I'm picturing the following D3 pseudocode for drawing a point:
Careful mental construction informs us that simply having knowledge on a point's radius and Cartesian coordinates (r, x, y) would be sufficient conditions to handling the visualization.
Given these minimal sufficient parameters, let us first build a helper function to create a point object that we will be reusing throughout this section.
// helper function to create a pointfunctioncreatePoint(r,x,y){varpoint={r: r,x: x,y: y,};returnpoint;}
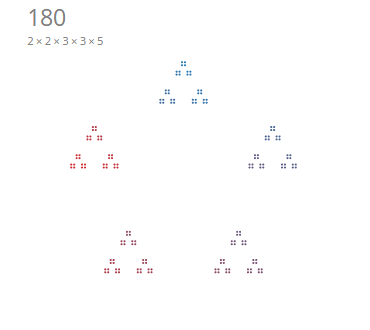
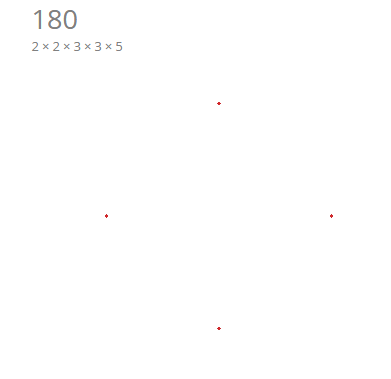
We will use the number 180 = [4, 3, 3, 5] as a sample number in this section to help us organize our implementation for generatePoints.
Recall that we are treating 2 × 2 as 4 for purposes of visualization.
We see that 180 is constructed in rings of 5 -> 3 -> 3 -> 4 (counting from outer rings to inner rings), which is exactly the reverse order of the factors array ([4, 3, 3, 5]) that we generated with primeFactors.
This suggests that we can utilize a loop going through elements in the array in reverse order to iteratively generate points. We would terminate the loop when we exhaust all factors in the array.
A starting template for generatePoints could look like this:
/** * Generate and distribute points */functiongeneratePoints(factors){// initialize variablesvarpoints=[];varx,y,r,point;while(factors.length){n=factors.pop();// build points from outwards// code to update x, y, r and create points}returnpoints;}
With this template in place, we can try to express the other variables x, y, r in terms of n (i.e. x, y, r, are functions of n).
We first notice that the r should be divided by some factor of n to allow us to fit n points within a unit area. Let's assume for simplicity that r as a function of n can be written as:
r=1/n
Next, we observe that n represents the number of vertices of a subgroup, which will allow us to evenly generate angles a to radially distribute the points.
d3.range(n).forEach(function(i){a=i*2*Math.PI/n}
From basic trigonometry, we know that x and y can be calculated as a function of the angle a:
x=Math.cos(a);y=Math.sin(a);
We now have a complete set of generated values x, y, and r that satisfies our minimum requirements for plotting points. We can now create a point object using our helper function createPoint(r, x, y).
To recap, generatePoints now looks something along the lines of:
functiongeneratePoints(factors){// initialize variablesvarpoints=[];vara,x,y,r,point;while(factors.length){n=factors.pop();// build points from outwardsr*=1/n// scale r smaller by n each loop iterationd3.range(n).forEach(function(i){// loop through each vertexa=i*2*Math.PI/n// calculate the angle of the pointx=Math.cos(a);// update xy=Math.sin(a);// update ypoint=createPoint(r,x,y);// create point objectpoints.push(point);// add to points}}returnpoints;}
If we try to plot these generated points with D3, we notice something terribly wrong:
We are only generating a total of 4 + 3 + 3 + 5 = 15 points when we need to generate 180 = 4 * 3 * 3 * 5 points.
We need to somehow build points from the outer set of points and for each of those points, multiply out the inner points recursively.
We can achieve this through the use of a temporary variable parentPoints, which holds a list of all current points in the loop that provide a reference to build out more points for each of the parent points. Our general while loop needs to account if we are on the outer loop or within the recursive inner loop, and this can be implemented by providing a check on points.length == 0.
functiongeneratePoints(factors){varparentPoints=[];varpoints=[];vara,x,y,r,point;while(factors.length){n=factors.pop();r*=1/nif(!points.length){// account for first set of pointsd3.range(n).forEach(function(i){a=i*2*Math.PI/nx=Math.cos(a);y=Math.sin(a);point=createPoint(r,x,y);points.push(point);});}else{// if we enter the inner loop, we need to create points based on parent pointsparentPoints=points.slice();// create shallow copy of pointspoints=[];// reset points array;parentPoints.forEach(function(parentPoint){// build new points using parentPoints as a templated3.range(n).forEach(function(i){a=i*2*Math.PI/n+da;x=Math.cos(a);y=Math.sin(a);point=createPoint(r,x,y);points.push(point);});})}}returnpoints;}
When we check points.length in the JavaScript console, we see that the dimension of the array now matches up correctly to the number, but a quick look at the visualization shows that the dimensions are all wrong! Here's what it would look like for 180 based on our current implementation of generatePoints.
A number of things are clearly wrong at this point. We notice that the points are all stacked on each other when they should be fanning out from their parent points. The radius scaling is also not correct.
The immediate fix we should make lies in the generation of child points from parent points. We notice that the general trigonometry formulas don't quite work:
x=Math.cos(a);y=Math.sin(a);
The new child points need to be drawn with the parent point's location as a frame of reference. Luckily, we have access to this from the parentPoint object that we created. A simple change here will be to specify the parentPoint location as the frame of reference:
parentPoints.forEach(function(parentPoint){d3.range(n).forEach(function(i){a=i*2*Math.PI/n+da;x=parentPoint.x+Math.cos(a)/d;// refer to x position of parentPoint;y=parentPoint.y+Math.sin(a)/d;// refer to y position of parentPoint;point=createPoint(r,x,y);points.push(point);});})
If you are still paying attention, you noticed that I have introduced a variable d, which represents the depth factor that we need to scale as we enter each recursive loop. This scale factor should depend on n since every time we arrive at a nested set of n vertices, we should scale all our dimensions down by a factor of n. We will introduce d at the very start of our while loop.
functiongeneratePoints(factors){varparentPoints=[];varpoints=[];vara,x,y,r,point;vard=1;// initiate dvarn=1;// initiate nwhile(factors.length){d*=n// scale d by nn=factors.pop();r*=1/nif(!points.length){d3.range(n).forEach(function(i){
...
points.push(point);});}else{parentPoints=points.slice();points=[];parentPoints.forEach(function(parentPoint){d3.range(n).forEach(function(i){a=i*2*Math.PI/n+da;x=parentPoint.x+Math.cos(a)/d;// d applied on child pointy=parentPoint.y+Math.sin(a)/d;point=createPoint(r,x,y);points.push(point);});})}}returnpoints;}
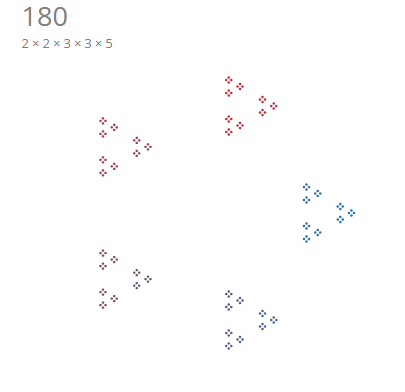
Now testing our visualization in D3 yields something that looks much more decent:
We notice that there are slight issues with the orientation/rotation or our current visualization. I will leave this for the user to confirm that a simple introduction of an offset variable da (which is also a function of n) can help fix this problem. In general, the offset should be set as:
da = -Math.PI / 4 when n == 4 (i.e. rotate 90 degrees)
da = 0 when n == 2 (i.e. keep at default 0 degrees)
da = -Math.PI / 2 otherwise (i.e. rotate 180 degrees)
Applying the introduction of the da variable and including this as part of the construction of the angle a yields us our finalized formulation of the function generatePoints:
/** * Generate and distribute points */functiongeneratePoints(factors){varparentPoints=[];varpoints=[];vara,x,y,da,point;varn=1;varr=1;vard=1;while(factors.length){d*=n;// scale depthn=factors.pop();// build points from outwardsda=n===4 ? -Math.PI/4 : n===2 ? 0 : -Math.PI/2;// apply offset logic herer>1/100 ? r*=1/n : r*=0.7;// aesthetic scale factor to increase size at higher values of nif(!points.length){// account for first set of pointsd3.range(n).forEach(function(i){a=i*2*Math.PI/n+da;// apply offset da to angle ax=Math.cos(a);y=Math.sin(a);point=createPoint(r,x,y);points.push(point);});}else{// iteratively build points by keeping track of parentPointsparentPoints=points.slice();points=[];parentPoints.forEach(function(parentPoint){d3.range(n).forEach(function(i){a=i*2*Math.PI/n+da;// apply offset da to angle ax=parentPoint.x+Math.cos(a)/d;y=parentPoint.y+Math.sin(a)/d;point=createPoint(r,x,y);points.push(point);});})}}returnpoints;}
And our visualization is now looking right and great.
That was a heavy section, so let's wrap it up in a quick summary:
Find a way to generate variables x, y, r (minimal plotting requirements) from knowledge on the factors array.
The factors array encodes information on n vertices, which we found ways to express x(n), y(n), r(n), a(n), d(n), da(n) as functions of n.
We break the generation of points into an generating an initial set of outer points, followed by a recursive logic of generating nested inner points while applying the neccessary depth scaling factors.
Visualization components
In the previous section, we made "invisible" mention and displayed images to the visualization without describing its implementation. The goal of the previous section was to focus only on the logic of generating the right points data that D3 can use for plotting.
The goal of this section is to now build on how we inform D3 to take the points data and plot the results.
At the highest of level, our visualization application should run with three simple calls:
// initiate vis objectvarvis={};// call an initialization function to build visinit();// setup an interval reference to update based on a set speedvarinterval=setInterval(update,speed);
You can see this simple call at the top of the draw.js file. What remains now is to implement init and update.
There are a number of things we should initialize in the vis object:
vis.size: size of the SVG
vis.speed: to determine how fast setInterval calls update
vis.number: the number to be factorized and visualized
vis.factors: the factor array for vis.number
vis.points: the points generated when vis.factors is passed into the generatePoints i.e. the function we wrote in the previous section
vis.scale: the scale and domain range of the visualization
vis.svg: the main SVG object that D3 will build upon
vis.trackerNumber: the number that we will display in the visualization
vis.trackerFactors: the string representation of the factorization of vis.number
Following the above requirements, here is our implementation for the init function:
functioninit(){// vis parametersvis={size: 250,number: 1,speed: 1000,};// get prime factorsvis.factors=primeFactors(vis.number);// build data pointsvis.points=generatePoints(vis.number);// build scalevis.scale=d3.scale.linear().range([0,vis.size]).domain([-1,1]);// build vis svgvis.svg=d3.select("#vis").append("svg").attr("height",2*vis.size).attr("width",2*vis.size).append("g").attr("transform","translate("+[vis.size/2,vis.size/2]+")");// build vis tracker numbervis.trackerNumber=vis.svg.append("svg:text").classed("trackerNumber",true).attr("x",-vis.size/3).attr("y",-vis.size/3).attr("font-size","30px").attr("fill","gray");// build vis tracker factorsvis.trackerFactors=vis.svg.append("svg:text").classed("trackerFactors",true).attr("x",-vis.size/3).attr("y",-vis.size/3+25).attr("font-size","14px").attr("fill","gray");}
The next section is to help build the logic of our update function, which will be repeatedly called by setInterval to update numbers and the visualization.
update should handle:
updating vis.number and vis.factors.
regenerate vis.points when vis.factors is updated.
update vis.colorScale since we have to update our color domain range due to changing array size.
apply transition effects for new data, old data, shifting data
We will first handle updates to vis.number, vis.factors, vis.points, and vis.colorScale:
/** * Update function for setInterval */functionupdate(pos){// extend functino with the option to pass a direction// to either increment or decrement vis.number// i.e. if true, increase vis.number, if false, decrease vis.numberpos ? vis.number++ : vis.number>2 ? vis.number-- : vis.number;vis.factors=primeFactors(vis.number);// update factors// update trackervis.trackerNumber.transition().text(vis.number);vis.trackerFactors.transition().text(printFactors(vis.factors));// update pointsvis.points=generatePoints(vis.factors);// create new points// make a reference to each point objectvarpoint=vis.svg.selectAll(".point").data(vis.points);// update colorscalevis.colorScale=d3.scale.linear().domain([0,vis.points.length])// rescale since vis.points.length has changed.range(["#1f77b4","#d62728"]);}
Updates and transitions
In the earlier section, we made a D3 selection reference to point in the update function i.e.
We can now build on this selection and construct enter, exit, transition animations:
/** * Update function for setInterval */functionupdate(pos){
...
varpoint=vis.svg.selectAll(".point").data(vis.points);// enterpoint.enter().append("svg:circle").classed("point",true).attr("r",0).transition().duration(vis.speed/2).attr("r",function(d){returnd.r*vis.size;})// scale radius of data point with size of vis.attr("cx",function(d){returnvis.scale(d.x);})// apply vis.scales to x and y.attr("cy",function(d){returnvis.scale(d.y);}).attr("fill",function(d,i){returnvis.colorScale(i);});// apply vis.colorScale to index of data points// updatepoint.transition().duration(vis.speed/2).attr("r",function(d){returnd.r*vis.size;}).attr("cx",function(d){returnvis.scale(d.x);}).attr("cy",function(d){returnvis.scale(d.y);}).attr("fill",function(d,i){returnvis.colorScale(i);});//exitpoint.exit().transition().duration(vis.speed/2).attr("r",0).remove();}
We are now done with our implementation of init and update and we can initialize our D3 visualization with three simple calls!
We can provide a few interactive options for the users without overcomplicating our D3 code by initiating these interactions in the init function, and pausing and resetting intervals with the use of setInterval and clearInterval.
Let's build out the set of HTML widget controls and tag them with unique ids so D3 can select and reference them:
For the search implementation, we assume that the user is prompted to pause and reflect on their searched result. We achieve this by stopping the interval using clearInterval, and making one manual call to update to visualize the desired result.
One small thing to pay attention is that update alters vis.number, so we have to pass it n - 1 if we wish to visualize n:
This work would not be possible without the original creative ideas and implementations made by others. I hope that my tutorial and implementation will spark interest in many others to share and expand on the foundations built for us.


