- Sorting segments within a stacked bar chart: http://kb.tableau.com/articles/howto/sorting-segments-within-stacked-bars-by-value
- Pareto 2-part area chart: http://www.vizwiz.com/2016/08/tableau-tip-tuesday-how-to-create-two.html
- Doughnut charts: http://www.evolytics.com/blog/tableau-201-how-to-make-donut-charts/
- Hex maps: http://sirvizalot.blogspot.com/2015/11/hex-tile-maps-in-tableau.html
- Tile maps: http://www.bfongdata.com/2015/11/periodic-table-map.html
- Small multiple-tile maps: http://sirvizalot.blogspot.com/2016/05/how-to-small-multiple-tile-map-in.html
- Date Functions: https://onlinehelp.tableau.com/current/pro/desktop/en-us/functions_functions_date.html
- Which chart is right for you? (Whitepaper): http://www.tableau.com/learn/whitepapers/which-chart-or-graph-is-right-for-you
- Sometimes data types differ between live connection and extract. Particularily converting strings in MySQL to numbers in Tableau. Particularily have issues w/ string-to-date: http://kb.tableau.com/articles/issue/converting-string-to-date-time-causes-null-values
- MySQL Substring Index: https://coderwall.com/p/zzgo-w/splitting-strings-with-mysql
- To add multiple data sources to project, but not joining them: https://community.tableau.com/thread/152524
- Copy information across workbooks (copy worksheets): https://onlinehelp.tableau.com/current/pro/desktop/en-us/copy_b_wkbks.html
- Level of Detail whitepaper: http://www.tableau.com/sites/default/files/whitepaper_lod_eng_high.pdf
- What is a logarithmic axis?: http://paintbynumbersblog.blogspot.com/2013/04/demonstrating-how-logarithmic-scales.html
- Gantt Chart using small time increments: http://kb.tableau.com/articles/knowledgebase/gantt-chart
- Sorting dimensions based on Percent of Total: https://community.tableau.com/thread/149232
- DATEPART Functions: https://onlinehelp.tableau.com/current/pro/desktop/en-us/functions_functions_date.html
- Intro to Level of Detail expressions: http://www.ryansleeper.com/tableau-fundamentals-introduction-level-detail-expressions/
- Table Calcs explained: http://www.vizwiz.com/2017/02/table-calcs.html
- 5 table calcs you need to know: https://www.interworks.com/blog/tmccullough/2014/09/29/5-tableau-table-calculation-functions-you-need-know
- Total vs. Window_Sum: https://community.tableau.com/docs/DOC-5640
- Marimekko Chart: http://www.datarevelations.com/dr-strangechart.html
- Calculating latest month, previous month, previous 3 months, previous N months: http://www.vizwiz.com/2017/03/latest-previous-prior.html
- Show week ending date instead of beginning: https://tableautinkering.wordpress.com/2014/11/16/tinkering-with-week-dates/
- full calculation reference: https://onlinehelp.tableau.com/current/pro/desktop/en-us/functions.html
- Dashboard Actions: http://onlinehelp.tableausoftware.com/current/pro/online/mac/en-us/actions.html
- Figuring out correlations: http://www.thedataschool.co.uk/nai-louza/correlations-trend-lines-formulas-tableau/
- Calculating correlation coefficients: http://www.thedataschool.co.uk/emily-dowling/calculate-correlation-coefficient-tableau/
- resumes in Tableau = http://pointsofviz.com/the-best-resumes-on-tableau-public/
- Steve Wexler jittering: http://www.datarevelations.com/ive-got-the-jitters-and-i-like-it.html
- Ryan Sleeper jittering: http://www.evolytics.com/blog/tableau-201-make-customizable-jitter-plots/
- Nested Sorting: http://www.thedataschool.co.uk/mina-ozgen/4-infinite-ways-perform-nested-sorting-not-recommended/
- Compare a month to historical avg: https://youtu.be/AvKPk_If790
- Assigning shapes to non-present values: https://www.interworks.com/blog/cmsanders/2016/08/09/assigning-shapes-non-present-values-tableau
- Filtering top across panes: https://www.tableau.com/learn/tutorials/on-demand/filtering-top-across-panes?reg-delay=beedbebe69f56567c4e458e58dc406f2
- Text formatting like Pooja: https://thedataduo.com/2017/07/04/lets-talk-about-text/
- Hide title in Tableau: https://vizpainter.com/hide-titles-in-tableau/
- Big Number KPI formatting: http://www.thedataschool.co.uk/gwilym-lockwood/i-like-big-numbers-i-cannot-lie-make-numbers-pop-kpi-dashboards-tableau/
- Michael Mixon using GIMP to obscure photo: https://mixpixviz.blogspot.com/2017/03/anatomy-of-viz.html
- Getting started with MapBox: https://vizalicious.com/2017/07/12/getting-started-with-mapbox/
-
Tools
-
Tableau Polygon Drawer: http://drawingtool.powertoolsfortableau.com/#
-
Resources
-
Example Walkthrough: Sydney Ferries = http://sonsofhierarchies.com/?p=191
-
Tableau Learning Blog = https://learningtableaublog.wordpress.com/2017/05/06/takeaparttuesday-polygon-maps-on-background-images/
-
Calculate the maximum value in a group (which User finished the most Tasks per Epic in JIRA: https://community.tableau.com/thread/122191
- table calculation: Highest Score
SUM([Score])=WINDOW_MAX(SUM([Score]))- compute the calculation using the "User" field
-
Corellation Coefficient: http://www.thedataschool.co.uk/emily-dowling/calculate-correlation-coefficient-tableau/ 1/(SIZE()-1) * WINDOW_SUM(( (SUM([Profit])-WINDOW_AVG(SUM([Profit]))) / WINDOW_STDEV(SUM([Profit]))) * (SUM([Sales])-WINDOW_AVG(SUM([Sales]))) / WINDOW_STDEV(SUM([Sales])))
- LOD calcs
- general consensus of using LOD’S is that 1) if the data is the view use Table Calcs 2) if the data in not in the view use LODS calculations.
- LODS always start within an open pistachio {
- Followed by One of the three scoping keywords (Fixed, Include, Exclude)
- Followed by the dimensions you want to be fixed, included or excluded from the computation – note this is a comma – separated list of * dimensions’ fields that define the level of detail at which the calculation will be performed.
- Followed by a colon :
- Followed by an aggregated function (i.e sum, avg, min)
- Followed by an aggregated measure/s
- Ending with a closing pistachio }
- To start TabPy: https://github.com/tableau/TabPy/blob/master/server.md, need to manually start the tabpy server batch file
- tableau/TabPy#21
- Set Project Level "All Users" permissions to 'None' to get Group Permissions to work: http://onlinehelp.tableau.com/current/guides/everybody-install/en-us/everybody_admin_permissions.htm
- Visualizing DISTRIBUTIONS: http://www.darkhorseanalytics.com/blog/visualizing-distributions-3
- 45 ways to communicate TWO QUANTITIES: http://www.scribblelive.com/blog/2012/07/27/45-ways-to-communicate-two-quantities/
- 9 ways to visualize PROPORTIONS: http://flowingdata.com/2009/11/25/9-ways-to-visualize-proportions-a-guide/
- 11 ways to visualize CHANGE OVER TIME: http://flowingdata.com/2010/01/07/11-ways-to-visualize-changes-over-time-a-guide/
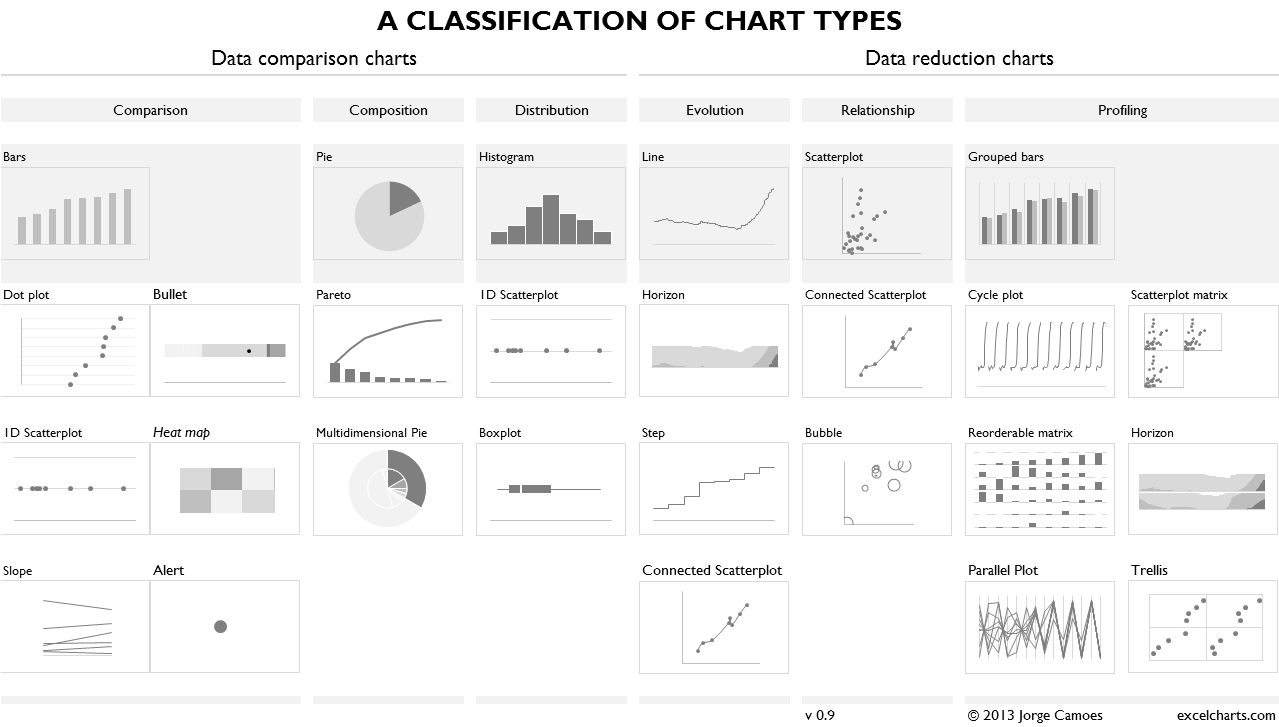
- Charting taxonomy: http://www.excelcharts.com/blog/wp-content/uploads/2013/11/classification-chart-types.png