This gist details the decisions I made, the tests I conducted, the observations recorded, and the directions I took while building out projects during the senior phase of the HackReactor Bootcamp.
Last active
June 2, 2023 20:00
-
-
Save danny-avila/1387fef054da77737e1ce4d04172afe4 to your computer and use it in GitHub Desktop.
SDC Engineering Journal
Today we kicked off our SDC app. We inherited an app from a previous cohort (team aerio's) and we each created a repo for our individual API service. We also set up a Github organization for our team and gave access to Michelle Lockett and the staff members. We created a Trello board to track our progress and linked it to the SDC tracker. We also made a slack channel for our team communication. We spent 30 minutes reviewing the deliverables tracker and the Learn documentation. Then we decided on our workflow for completing our journals and supporting each other. We also divided the services among ourselves and started researching databases for our API.

-
Created the initial database schema in SQLDesigner XML format for an e-commerce product page, covering Product, Styles, Photos, SKUs, Features, and Related Items tables with their relationships.
-
Added Mongoose schemas for the e-commerce product page, including Product, Styles, Photos, SKUs, Features, and Related Items.


- Completed PostgreSQL database connection and removed unnecessary module imports in index.js (refactor)
- Added PostgreSQL database connection configuration (feat)

- Added
/db/datato.gitignore. UpdatedPOSTGRES_PASSWORDenvironment variable usage for password. - Added Jupyter notebook for importing CSV data into PostgreSQL.
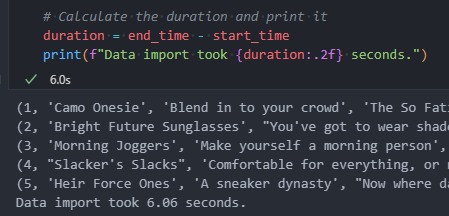
- Timed the import to mark progress

- Brought down import of products csv (274mb file) to 6 seconds from 10
Today, I worked on refining the ETL process for importing CSV data into PostgreSQL. There were a few caveats and new findings I needed to address to ensure the process works smoothly and handles different scenarios.
- Header name variations: Some of the CSV files had different header names for the same field, like "productId" and "current_product_id" instead of "product_id". To handle this dynamically, I updated the header names in the DataFrame using a list comprehension:
headers = ["product_id" if header in ["productId", "current_product_id"] else header for header in headers]-
Related items field: I needed to indicate the relationship and index the
related_product_idfield in therelated_itemstable, which is a product_id. To do this, I added a foreign key constraint for this field referencing theproductstable and created an index for therelated_product_idfield. -
Transforming 'null' values: In the
stylestable, thesale_pricefield had some values listed as 'null'. I needed to transform these to 0. To achieve this, I added the following snippet before inserting the data into the table:
if table_name == "styles":
    df['sale_price'] = df['sale_price'].apply(lambda x: 0 if x == 'null' else x)
I updated my SQL table design after thoroughly reviewing the data I'm extracting.

Foreign Keys are italicized, primary are bold
Summary:
- Renamed the "product" table to "products" for consistency.
- Added primary keys for "features" and "related_items" tables.
- Added foreign key constraints and relationships for "related_product_id" in the "related_items" table.
- Changed the primary key constraint for "photos" table to "style_id" as you mentioned it should be the primary key.
- In the "styles" table, the primary key has been updated to "id" instead of "style_id".
- In the "photos" table, the primary key constraint now includes the "id" row. The "style_id" row has a foreign key relationship with the "styles" table.
- The "SKUS" table now has a new row "id" that is set as the primary key. The "style_id" row has a foreign key relationship with the "styles" table.
- In the "features" table, a new row "id" has been added and set as the primary key. The "product_id" row has a foreign key relationship with the "products" table.
- The "related_items" table now has a new row "id" that is set as the primary key. The "product_id" row has a foreign key relationship with the "products" table. The "related_product_id" row has a foreign key constraint with the "products" table.
Encountered a ParserError while reading photos.csv with pandas due to an unexpected 5th column. Checked the data here and there were only a dozen outliers out of the thousands in the dataset, and noticed they were duplicates of the 4th column. Fixed it by specifying the valid columns using the usecols parameter in pd.read_csv():
photos_file = "./db/data/photos.csv"
columns_to_use = [0, 1, 2, 3] # Only use the first 4 columns
df_photos = pd.read_csv(photos_file, usecols=columns_to_use)
I also encountered a few other issues with my Python code:
The second issue I faced was a SyntaxError when trying to create a table with a dynamically generated SQL statement. The problem was that the foreign_key variable was empty for the products table, which led to an incorrect SQL statement. I fixed it by checking if the foreign_key was empty before including it in the CREATE TABLE statement.
I encountered a DependentObjectsStillExist error when trying to drop the products table. The error occurred because there were other objects (e.g., foreign key constraints) that depended on this table. I resolved the issue by using the CASCADE option in the DROP TABLE statement to automatically drop all dependent objects along with the table, as I'm dropping tables when importing again:
drop_table_sql = f"DROP TABLE IF EXISTS {table_name} CASCADE;"Also, a function was not handling edge cases of null values and floating number strings ('100.00') correctly in a pandas DataFrame. Specifically, the apply(lambda) function was not able to convert a floating-point value to an integer, while also throwing an error with the astype(pd.Int64Dtype()) at the end of the lambda function. To fix this issue, I modified the lambda x function to first check if the input value is null or NaN, and if it is, return zero. Then, if it is not null or NaN, I converted it to a float and rounded it to two decimal places before converting it to an integer. The new code looked something like this:
df['sale_price'] = df['sale_price'].apply(lambda x: 0 if pd.isna(x) or x == 'null' else int(round(float(x), 2))).astype('Int64')Lastly, I had one final issue when importing related_items; I was encountering a foreign key violation error because some of the "related_product_id" values in the "related_items" table were not present in the "products" table. To solve this, before inserting the data, I filtered out the rows with non-existent "product_ids" in the "related_items" table. The filtering was done using pandas and a subquery to the "products" table, which selected only the "id" values that existed in the "products" table. The filtered data was then used for the insert operation.
I modified my "insert_data" function from:
def insert_data(df, table_name, cur):
    csv_buffer = StringIO()
    df.to_csv(csv_buffer, index=False, header=False)
    csv_buffer.seek(0)

    columns = ", ".join(df.columns)
    cur.copy_expert(f"COPY {table_name} ({columns}) FROM STDIN WITH CSV", csv_buffer)
to:
def insert_data(df, table_name, cur):
    # Filtering
    if table_name == "related_items":
        conn_subquery = create_conn()
        cur_subquery = conn_subquery.cursor()
        df = df.loc[df["product_id"].isin(pd.read_sql("SELECT id FROM products", cur_subquery).id.tolist())]
        cur_subquery.close()
        conn_subquery.close()

    csv_buffer = StringIO()
    df.to_csv(csv_buffer, index=False, header=False)
    csv_buffer.seek(0)

    # Use the COPY command to import the data
    columns = ", ".join(df.columns)
cur.copy_expert(f"COPY {table_name} ({columns}) FROM STDIN WITH CSV", csv_buffer)After troubleshooting all of the above, the data necessary for the overview service (over 2 gb) was successfully extracted in 4 minutes and 6 seconds. This included querying the first 5 items in each table to print the progress as seen below

I ran the following queries to determine if the frontend can successfully query in less than or close to 50 ms
mydb=# EXPLAIN ANALYZE SELECT * FROM related_items WHERE product_id = 50;
mydb=# EXPLAIN ANALYZE SELECT * FROM photos WHERE id = 588908;


screenshot of count of records of primary table/collection

- https://hakibenita.com/fast-load-data-python-postgresql
- https://medium.com/analytics-vidhya/part-5-2-pandas-dataframe-to-postgresql-using-python-450607b763b4
- https://petl.readthedocs.io/en/stable/
- https://stackoverflow.com/questions/47333227/pandas-valueerror-cannot-convert-float-nan-to-integer
- https://stackoverflow.com/questions/8134602/psycopg2-insert-multiple-rows-with-one-query
Ran the ETL script again with less processes on my computer running, still takes about the same time

I improved and implemented product and cart controller methods for my Express app based on the API documentation. For the product controller, I implemented the product getAll and getOne methods, the getStyles method to fetch a product's styles, photos, and SKUs, and the getRelated method to return related product IDs. I created get and post methods for the cart controller to retrieve cart items and add items to the cart, respectively. I utilized PostgreSQL's JSON functions to optimize the getStyles method, making it more efficient and eliminating additional queries.
Overall, I successfully initialize my API server, and defined the routes as expected.


I've implemented the controller methods for the following, but the database does not yet handle users router.get('/cart', controllers.cart.get); router.post('/cart', controllers.cart.post);
My team member put me on to json_agg which simplified the query for getStyles but it did not improve speed.
- Added tests for product controller methods in the 'controllers.test.js' file.
- Created tests for product routes and error handling in the 'routes.test.js' file.
- Fixed an issue in 'server/controllers/index.js' by converting 'product_id' to an integer before sending the response.
- This was due to emulating the response from the Atelier API where product_id is returned as a string in the styles response. In keeping true to the schema, I converted this to integer
- I removed the cart endpoints as making this service is not a requirement for this project

- Standup with group:
- Discussed team's progress
- Discussed my progress: have server, queries, routes, and tests done, but will modify to match the shape/data of Atelier
- For styles: Opted for json_agg to build the styles query for a little more efficiency and shaping the data easier
- Learned Stress testing principles and tools: Google doc with info from group activity with classmates
- I started setting up the frontend environment I will be working with to test
I was working on another computer today so I saw it as an opportunity to reformat my ETL process to match the expected shape better. Again, this mainly concerns the styles query as it is the most complex data shape my service is delivering.
- Modified the ETL script to rename the 'id' column in the styles table schema to 'style_id'.
- Updated the primary key constraint definition for the styles table to use 'style_id' instead of 'id'.
- Revised the foreign key constraint definition for 'style_id' to reference the 'style_id' column in the styles table.
- Ensured that the foreign key constraint for 'style_id' is only added when the table name is not 'styles'.
- I ran into some memory issues on the remote computer since it has 16 gb as opposed to the 64 gb i have at home, so I modified the insert_data function to process the DataFrame in smaller chunks instead of loading the entire DataFrame into memory at once. This approach reduces the memory usage and helps prevent memory-related errors.
-
I added a new parameter called chunksize to the insert_data function. This parameter defines the number of rows to be processed in each chunk. A smaller chunk size will use less memory but will require more iterations to process the entire DataFrame.
-
Calculated the total number of chunks required to process the entire DataFrame by dividing the total number of rows by the chunksize and rounding up the result.
-
Used a loop to iterate through each chunk, processing one chunk at a time. For each chunk, I determined the starting and ending row indexes based on the current chunk index and the chunksize.
-
Created a new DataFrame called df_chunk that contained only the rows within the current chunk's range (from starting index to ending index).
-
Prepared the data in df_chunk as a CSV string and inserted it into the database using the same cur.copy_expert() call as before.
-
The import was comparable to the time it took on my computer, only slower by 14 seconds

- Ran tests to confirm all is well:

After I replaced all legacy Atelier network calls in the front end app/server to get data from my API service, I noticed some issues. My service was not properly handling the case where there is no data in the photos and skus tables WHERE style_id = 8. I also wasn't conforming to the exact data shape expected as I hadn't strictly tested for this. The issue with my query was that I was joining both photos and skus tables with the styles table using LEFT JOIN, creating a Cartesian product of photos and skus for each style, which results in duplicate photos. To handle this, I did the following:
- Identified the performance issue with the initial query that used multiple LEFT JOINs, causing a noticeable delay in fetch time.
- Optimized the query by breaking it down into three separate queries: one for styles, one for photos, and one for skus.
- Ensured that the new version of the code handles null values in photos and skus correctly, as per the provided examples.
- Further optimized the queries by running them concurrently using Promise.all() and updated the processing part of the code to handle the results correctly.
- Tested and verified that the final version of the getStyles function works as expected and has improved performance.

I was still having issues with the Aerio FEC frontend app, even after double-checking my api results. I concluded there were issues with some frontend logic being too tightly coupled between different Atelier endpoints, noting the deliverable comment: "Your widget should still load locally, regardless of other services." I tried my own team's FEC app, and after replacing legacy calls for my service, all worked perfect!

This concludes this week's deliverables.
I don't know if I'll get to making an integration of mongodb, but I'm not worried since I am a lot more familiar with mongodb.
If i have time, i'll make tests that test for the data shape explicitly of each controller result.
Today, I worked on the deliverable to measure API read query run times. I had already indexed primary and foreign keys in PostgreSQL before this task.
I ran the following commands with random parameters for all of my DB read queries below. I've included the results following each query.
EXPLAIN ANALYZE SELECT * FROM products LIMIT 7 OFFSET (7 - 1) * 5;

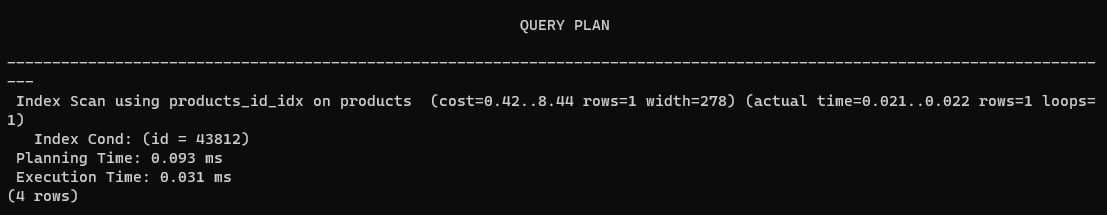
EXPLAIN ANALYZE SELECT * FROM products WHERE id = 43812;
EXPLAIN ANALYZE SELECT * FROM styles WHERE product_id = 69214;

EXPLAIN ANALYZE SELECT * FROM photos WHERE style_id = 81345;

EXPLAIN ANALYZE SELECT * FROM skus WHERE style_id = 95987;

EXPLAIN ANALYZE SELECT related_product_id FROM related_items WHERE product_id = 27358;

Performed my first stress test on the micro-service using the k6 performance testing tool. The test comprised three stages to simulate varying user loads and evaluated the application's performance under these conditions.
Test Configuration:
- Ramp up: Increased the number of virtual users from 0 to 20 over 30 seconds.
- Peak load: Further increased the virtual users from 20 to 100 over the next minute.
- Ramp down: Decreased the virtual users from 100 to 20 over the final 30 seconds.
Test Results:

- A total of 22,800 requests were sent, with zero failed requests.
- The server managed an average request duration of 1.23ms.
- The server successfully handled the increasing user load during the test.
Conclusion: The stress test demonstrated that the server performed well under varying user loads, maintaining an acceptable performance level. I think I can start ramping up the stress as a stress limit is not reached.
After the initial stress test, a more demanding k6 script was executed to exert higher stress on the service. This new script increased virtual users and load ramping and shortened sleep time between requests, simulating high user activity.
Test Configuration:
- Fast ramp-up: Virtual users increased from 0 to 50 in 15 seconds.
- Peak load: Virtual users heightened from 50 to 250 during the following 45 seconds.
- Ramp down: Virtual users reduced from 250 to 50 for the last 30 seconds.
- Shorter sleep time: Each virtual user's sleep duration was 0.5 seconds, down from 1 second.
Test Results:

- Total requests: 92,248, with a 0.00% failure rate.
- Latency: Average request duration of 1.44ms; 90th percentile at 2.56ms, and 95th percentile at 3.25ms.
- Throughput: 1,019.356497 requests per second.
- The server handled the test well, with fast response times for each user.
Conclusion: Despite the increased stress, the micro-service maintained excellent performance; no requests failed and responses were quick. Although the server handled the test well, successive tests with varied scenarios or further increments in the load could help determine the stress limit accurately. Overall, the service proves reliable and performs swiftly under high-stress conditions.
To gain a deeper understanding of the stress limit for the Node.js Express application, a k6 script was executed with three distinct stress scenarios. The aim was to evaluate the server's capabilities under various traffic patterns and load fluctuations, including warm-up, peak stress, and extended stress.
Test Configuration:
warm_up: Gradual increase of virtual users from 0 to 50 over 1 minute.peak_stress: Beginning at 50 virtual users, rapid climb to 300 users within 30 seconds, sustaining peak load for 1 minute, then ramping down to 50 users in 30 seconds.extended_stress: Commencing with 50 virtual users, gradual increase to 100 users over 2 minutes, further ramp-up to 150 users within the next 3 minutes, and finally, decrease to 50 users over the last minute.
Test Results:

- Total requests: 268,628, with a 0.00% failure rate.
- Latency: Average request duration of 1.47ms; 90th percentile at 2.42ms, and 95th percentile at 3.16ms.
- Throughput: 496.917765 requests per second.
The server exhibited excellent performance across all three scenarios, quickly responding to each user's requests. The latency remained low, even at peak stress with 300 virtual users.
- In the
warm_upscenario, the server adjusted to the gradual increase in virtual users. This allowed for optimal performance during the more demanding scenarios to follow. - During the
peak_stressscenario, the server successfully managed a sudden burst of traffic (from 50 to 300 virtual users) without any failed requests or significant delays. It also coped with maintaining peak load for a full minute, demonstrating resilience under sudden, high-volume traffic. - The
extended_stressscenario showed the server's ability to perform consistently under fluctuating, prolonged stress. It demonstrated the server's capacity to handle the increased load in a sustained manner without degrading performance.
Conclusion: The products micro-service was able to successfully handle the various stress scenarios in the test, indicating a high level of resilience and performance. The stress limit has not been reached, as latency remains low and there were no failed requests. A big contributing factor maybe the local environment, and results may vary much more widely in the deployed environment. This comprehensive test provides valuable insights into the service's capabilities across a range of traffic patterns and load fluctuations, verifying its reliability under both sudden and sustained stress.
An extreme stress test was executed on the products micro-service to explore its stress limit in a local environment. A k6 script was designed to run within a 60-second duration and encompassed all suggestions for creating a highly stressful scenario:
Test Configuration:
- Extremely rapid escalation of virtual users from 0 to 1000 over 10 seconds, maintaining peak load for 20 seconds, and ramping down to 0 users within 30 seconds.
- Completely removed the sleep time between requests to maximize request frequency.
- Executed parallel API requests, forcing the micro-service to handle multiple requests simultaneously.
Test Results:

- Total requests: 149,596, with a 0.00% failure rate.
- Latency: Average request duration of 270.15ms; 90th percentile at 400.68ms, and 95th percentile at 411.25ms.
- Throughput: 2493.171018 requests per second.
The products micro-service was subjected to an extreme stress scenario, quickly responding to each user's requests. However, the latency values were considerably higher compared to the previous test.
- The rapid increase of virtual users (from 0 to 1000 within 10 seconds) created intense pressure on the micro-service as it attempted to manage the extreme workload.
- Completely removing sleep time between requests introduced a relentless influx of requests, constantly testing the micro-service's ability to keep up.
- Executing parallel API requests forced the micro-service to manage several requests concurrently, further pushing its limits and potentially leading to higher latency.
Despite the demanding workload, the error rate remained at 0.00%, indicating the products micro-service's resilience under extreme stress. However, the increase in latency during this short-duration test suggests that the stress limit has been approached.
Conclusion: This extreme stress test of the products micro-service provided valuable insights into its performance and limitations, pushing the system to its breaking point. I'm getting closer to the micro-service's stress limit due to the higher latency values (from single-digit ms to 271ms iteration durations). This information can be used to optimize the micro-service and ensure it remains reliable, even under the most demanding scenarios.
I didn't realize learn had specific instructions for stress testing, so for today, I will focus on getting the following done:
- Stress-test your service in development: Stress test your service in development (on your laptop), in isolation from other services, using the loaded application data set and realistic requests to your service's API by scaling the number of request per second: 1, 10, 100, 1K.
If your system fails at 100rps but works great at 10 rps, start testing to see where the failure point is. Meaning, you will try 50rps, 75rps etc until you find the point where your system begins to fail.
- Your ability to reach 1K RPS on your laptop will vary by choice of technology and laptop speed and you may not be able to reach this level of performance. If in doubt, ask your TM.
- Stress test all defined API routes. Measure RPS, Latency, and Error Rate for each request.
- Stress test tools in development (laptop): K6, Artillery or other JS based tool
- Consider using New Relic to report metrics about your servers' performance to the New Relic dashboard. At minimum, you must monitor response time (aka latency), throughput, and error rate -- these are the default metrics reported by New Relic. Other metrics may be useful to your specific application but are not required.
Introduction: A stress test was conducted on the products micro-service to analyze its capacity to handle 1 request per second (RPS) in a local environment. A k6 script was designed to execute requests at this rate, with each iteration testing all API routes.
Test Configuration:
- One scenario with one virtual user continuously testing all routes for 30 seconds.
- Each virtual user sends 1 RPS by introducing a sleep of 1 second between each request iteration.
Test Results:
- Total requests: 120, with a 0.00% failure rate.
- Latency: Average request duration of 1.66ms; 90th percentile at 2.05ms, and 95th percentile at 2.36ms.
- Throughput: 3.970069 requests per second (as each route is tested within the sleep iteration).
The products micro-service was tested at a rate of 1 RPS, which is a relatively low-stress environment. The micro-service quickly responded to user requests during the test. The following points further illustrate its performance:
- The average request duration was an impressively low 1.66ms. This indicates that the service efficiently processes user requests.
- At higher percentiles for latency (90th percentile at 2.05ms and 95th percentile at 2.36ms), the response time remains relatively low. This means that even under slightly more demanding conditions within this test, the service maintains consistent and fast response times.
- The error rate equals 0.00%, highlighting that the products micro-service experienced no issues in this low-stress test.
At the testing rate of 1 RPS for each virtual user, the stress limit of the products micro-service has not been reached. The micro-service was able to provide consistently fast response times to user requests while maintaining a low latency and zero error rate.
Conclusion: This stress test at 1 RPS demonstrated the products micro-service's ability to efficiently handle user requests with low response times, low latency, and an error-free performance. While this test did not approach the stress limit of the micro-service, it provides a clear baseline to be compared to subsequent, increasingly demanding scenarios in order to identify its breaking point and optimize its performance.
Test Configuration:
- One scenario with ten virtual users continuously testing all routes for 30 seconds.
- Each virtual user sends 10 RPS by introducing a sleep of 1 second between each request iteration for a total of 10 requests per sleep period.
Test Results:
- Total requests: 6,416, with a 0.00% failure rate.
- Latency: Average request duration of 920.99µs; 90th percentile at 1.2ms, and 95th percentile at 1.32ms.
- Throughput: 211.759801 requests per second (as each route is tested within the sleep iteration).
The products micro-service was tested at a rate of 10 RPS, which is a moderate-stress environment. The micro-service performed well under these conditions, as highlighted by the following key points:
- The average request duration increased to 920.99µs, which is higher than the 1 RPS test but still relatively low, indicating efficient processing of user requests.
- At higher percentiles for latency (90th percentile at 1.2ms and 95th percentile at 1.32ms), the response time remains reasonable, ensuring a good user experience even under more demanding conditions within this test.
- An error rate of 0.00% demonstrates the products micro-service's reliable performance at this stress level.
In this 10 RPS test, the stress limit of the products micro-service still has not been reached. The micro-service exhibited consistent response times, low latency, and an error-free performance under a higher stress level than the previous 1 RPS test.
Conclusion: The stress test at 10 RPS showed that the products micro-service can efficiently handle a moderate level of user requests. Response times, latency, and error rates all indicate satisfactory performance. Although the stress limit of the micro-service remains to be determined, this test provides an insightful comparison with the previous 1 RPS test. By continuing to increase the testing RPS, we can pinpoint the breaking point of the micro-service and optimize its performance accordingly.
Test Configuration:
- One scenario with a hundred virtual users continuously testing all routes for 30 seconds.
- Each virtual user sends 100 RPS by introducing a sleep of 1 second between each request iteration for a total of 100 requests per sleep period.
Test Results:
- Total requests: 80,200, with a 0.00% failure rate.
- Latency: Average request duration of 29.47ms; 90th percentile at 35ms, and 95th percentile at 39.23ms.
- Throughput: 2630.872757 requests per second (as each route is tested within the sleep iteration).
The products micro-service was tested at a rate of 100 RPS, which is a high-stress environment. The micro-service demonstrated an ability to function well under these conditions, as evidenced by the following points:
- The average request duration increased notably to 29.47ms when compared to the previous tests. This is evidence that the service is experiencing increased stress but remains efficient and able to process user requests.
- At higher percentiles for latency (90th percentile at 35ms and 95th percentile at 39.23ms), the response time demonstrates reasonable performance, considering the significantly increased stress level compared to the previous tests.
- The error rate remains at 0.00%, highlighting the products micro-service's reliability even in a high-stress environment.
In this 100 RPS test, it is not clear if the stress limit of the products micro-service has been reached yet, but response times have increased as stress levels rose. However, the micro-service has maintained low latency and an error-free performance under a high-stress scenario.
Conclusion: The stress test at 100 RPS illustrated that the products micro-service has the capability to handle high levels of user requests with reasonable response times, low latency, and an error-free performance. Determining the stress limit of the micro-service needs further testing with even higher RPS values. By continuing to incrementally increase the RPS, we can identify the breaking point of the micro-service and fine-tune its performance for optimal results.
Test Configuration:
- One scenario with a thousand virtual users continuously testing all routes for 30 seconds.
- Each virtual user sends 1000 RPS by introducing a sleep of 1 second between each request iteration for a total of 1000 requests per sleep period.
Test Results:
- Total requests: 75,892, with a 0.00% failure rate.
- Latency: Average request duration of 395.47ms; 90th percentile at 536.91ms, and 95th percentile at 563.75ms.
- Throughput: 2437.164676 requests per second (as each route is tested within the sleep iteration).
The products micro-service was tested at a rate of 1000 RPS, which represents an extreme-stress environment. The micro-service demonstrated a noticeable degradation in performance compared to previous tests, but still exhibited the following characteristics:
- The average request duration increased significantly to 395.47ms, which is expected in such an extreme-stress scenario. Although stress has risen, the micro-service still appears to be functioning.
- At higher percentiles for latency (90th percentile at 536.91ms and 95th percentile at 563.75ms), the response time has increased considerably, indicating that the service is reaching its limits under current conditions.
- Despite the immense stress, the error rate remains at 0.00%, which demonstrates the products micro-service's ability to handle requests without producing failures.
Based on this 1000 RPS test, it is uncertain if the stress limit of the products micro-service has been reached, but the substantial increase in response times suggests it could be nearing its breaking point. Further testing at even higher RPS values will help determine if a limit has been reached.
Conclusion: The stress test at 1000 RPS showed that the products micro-service can handle extreme levels of user requests, but performance degrades notably compared to tests at lower RPS values. The micro-service maintained an error-free performance but experienced increased latency under this extreme-stress scenario. To better understand the stress limit and capabilities of the micro-service, further testing with incrementally elevated RPS is necessary to identify its breaking point and optimize performance accordingly.
Test Configuration:
- One scenario with three thousand virtual users continuously testing all routes for 30 seconds.
- Each virtual user sends 1000 RPS by introducing a sleep of 1 second between each request iteration for a total of 1000 requests per sleep period.
Test Results:
- Total requests: 83,832, with a 0.00% failure rate.
- Latency: Average request duration of 1.15s; 90th percentile at 1.42s, and 95th percentile at 1.45s.
- Throughput: 2483.54999 requests per second (as each route is tested within the sleep iteration).
The products micro-service was tested at a rate of 3000 RPS, which represents an ultra-high-stress environment. The micro-service's performance degraded even further compared to the previous tests, as evidenced by the following points:
- The average request duration increased dramatically to 1.15s. At this level of stress, the response time has slowed substantially, and the micro-service seems to be reaching its limits.
- The higher percentiles for latency (90th percentile at 1.42s and 95th percentile at 1.45s) are significantly greater than in earlier tests. This indicates that user requests are taking much longer to complete, suggesting that the service is under extreme stress.
- Despite this considerable stress, the error rate remained at 0.00%, highlighting the products micro-service's ability to adapt and handle requests without producing failures.
In this test at 3000 RPS, the stress limit of the products micro-service appears to be nearing its breaking point, given the dramatic increase in response times. To determine if the stress limit has been reached, additional testing at even higher RPS values is necessary.
Conclusion: The stress test at 3000 RPS demonstrated that the products micro-service is capable of handling ultra-high levels of user requests, yet this comes with a substantial degradation in performance. While the micro-service continued to maintain an error-free performance, latency increased significantly under this ultra-high-stress scenario. Further testing with incrementally higher RPS values will help identify the precise breaking point of the micro-service and optimize its performance accordingly.
- Issue: Memory-related difficulties (RAM and disk space) when deploying to EC2 instance.
- EC2 instance setup for FEC.
- Attempted to set up a Jupyter notebook environment in the EC2 instance.
- Resulted in unnecessary setup complexity, and I couldn't get it working.
- Converted the notebook to a regular python script for importing.
- Fortunately, I have experience SFTPing to remote servers, and have a paid software that facilitates me with that.
- Memory issues required following actions: -had to first do each csv once per script run, drastically reduce the chunk size of the csv df being processed, and even delete csv files after importing.
- I increased my EC2 memory disk space in order to import the 1.5 gb photos csv file into my database, from 8 gb to 14 gb.
- I also had an unexpected hang time with the related csv import. This is probably due to indexing as it involves many different products, and I am indexing during import.
- Issue: Stray product ID not found in products table.
- My original script handles this but with only 1 gb of RAM, is not able to do it.
- I mitigated this by writing another script to filter the id from the original related items csv based off the products csv. It needs both in memory, so this had to be done on my local computer.
- It was smooth sailing from there, until I got to SKUs.
- This was a massive time sink, as my EC2 crashed twice in trying my working script.
- Through debugging, I realized the mixed data types in the size column was the problem. I started handling the csv file in chunks, and progress seemed good, but it would fail due to RAM issues nearly at the end of loading the csv.
- All of this warranted a separate script for SKUs.
In the context of processing a CSV file in two separate steps while utilizing the underlying original script structure, here are the changes I made:
- Defined a new function
process_chunksto process specific portions of the CSV file based on the given start and end row numbers. - Modified the
process_chunksfunction to accept start_row and end_row as arguments, allowing you to specify which portion of the CSV file to process. - Changed the chunk-processing loop inside the
process_chunks()function to process the rows only within the defined range. - Adjusted the
extract_from_csvfunction to accept an additionalcreate_tableflag, specifying whether the table in the database should be created or not. This helped resolve the issues related to duplicate table creation. - Moved the header renaming and assignment operations in the
extract_from_csvfunction outside of theif create_table:block, so they would be always executed regardless of the state of thecreate_tableflag.
The adjustments made ensured the script processed the CSV file in two separate steps and created the table only once, which resolved the memory-related errors encountered.
The adjusted script can now successfully process half of the rows of the SKUs file, clear the memory, and then proceed to process the remaining rows in the file while maintaining proper database operations.
Progress before i got it fully working: https://github.com/Prim-Tech/overview-service/assets/110412045/94e4fb2b-bf14-494f-a89c-3e2d73722f1d
EXPLAIN ANALYZE SELECT * FROM products LIMIT 7 OFFSET (7 - 1) * 5;

EXPLAIN ANALYZE SELECT * FROM products WHERE id = 43812;

EXPLAIN ANALYZE SELECT * FROM styles WHERE product_id = 69214;

EXPLAIN ANALYZE SELECT * FROM photos WHERE style_id = 81345;

EXPLAIN ANALYZE SELECT * FROM skus WHERE style_id = 95987;

EXPLAIN ANALYZE SELECT related_product_id FROM related_items WHERE product_id = 27358;


Introduction: A stress test was conducted on the products micro-service after deployment to analyze its capacity to handle 1 request per second (RPS). The same k6 script used for local server testing was employed to test the API routes, adjusting the base URL for the deployed server.
Test Configuration:
One scenario with one virtual user continuously testing all routes for 30 seconds.
Each virtual user sends 1 RPS by introducing a sleep of 1 second between each request iteration.
Test Results:
Total requests: 112, with a 0.00% failure rate.
Latency: Average request duration of 21.12ms; 90th percentile at 23.47ms, and 95th percentile at 24.15ms.
Throughput: 3.682148 requests per second (as each route is tested within the sleep iteration).
The products micro-service on the deployed server was tested at 1 RPS. Here are the main observations:
The average request duration increased to 21.12ms, compared to 1.66ms on the local server test. This indicates that the service remains efficient, but the deployed environment introduces additional latency.
The 90th and 95th percentiles for latency are 23.47ms and 24.15ms, respectively. These values are higher than those from the local server test (2.05ms and 2.36ms), but still provide reasonable response times.
There were no failed requests (0.00% failure rate), maintaining the same error-free performance as in the local server test.
While this deployed server test doesn't reach the stress limit of the products micro-service, it shows that the server can handle user requests with satisfactory response times and no errors.
Conclusion: The stress test at 1 RPS for the deployed server illustrated the deployed micro-service's ability to process user requests efficiently, albeit with increased latency compared to the local server. The performance remains error-free, providing a solid baseline to compare with further tests to optimize performance in the deployed environment.

Test Configuration:
One scenario with ten virtual users continuously testing all routes for 30 seconds.
Each virtual user sends 10 RPS by introducing a sleep of 1 second between each request iteration for a total of 10 requests per sleep period.
Test Results:
Total requests: 4,248, with a 0.00% failure rate.
Latency: Average request duration of 20.84ms; 90th percentile at 23.27ms, and 95th percentile at 25.18ms.
Throughput: 139.690486 requests per second (as each route is tested within the sleep iteration).
At 10 RPS in the deployed environment, the products micro-service demonstrated the following:
The average request duration of 20.84ms shows that the service still effectively processes user requests in the higher stress scenario relative to the 1 RPS deployed test (21.12ms).
The latency percentiles (90th percentile at 23.27ms and 95th percentile at 25.18ms) indicate that, similar to the 1 RPS deployed server test, response times remain reasonable even as stress increases.
The error rate remains at 0.00%, illustrating that the micro-service maintains its reliability and error-free performance at a higher stress level.
The stress test at 10 RPS on the deployed server confirmed that the products micro-service can handle increased user requests while still delivering satisfactory performance metrics.
Conclusion: The stress test at 10 RPS on the deployed server showed that the products micro-service continued to effectively handle increased user requests, with minimal impact on latency and no errors. As stress levels increase, further tests will be necessary to determine the breaking point and optimize the micro-service's performance in the deployed environment.

Test Configuration:
One scenario with a hundred virtual users continuously testing all routes for 30 seconds.
Each virtual user sends 100 RPS by introducing a sleep of 1 second between each request iteration for a total of 100 requests per sleep period.
Test Results:
Total requests: 18,328, with a 0.00% failure rate.
Latency: Average request duration of 154.45ms; 90th percentile at 178.74ms, and 95th percentile at 198.7ms.
Throughput: 585.825805 requests per second (as each route is tested within the sleep iteration).
At 100 RPS on the deployed server, the following performance metrics are observed:
The average request duration increased significantly to 154.45ms, revealing the impact of the stress compared to the 10 RPS deployed server test (20.84ms). Despite the increase, the micro-service can still process requests.
The latency percentiles show substantial increases (90th percentile at 178.74ms and 95th percentile at 198.7ms), indicating the high stress level's impact on response times compared to the 10 RPS deployed server test.
No failed requests were recorded (0.00% error rate), demonstrating the micro-service's maintained reliability despite the higher stress level.
This 100 RPS stress test on the deployed server illustrates a significant impact on request durations and latency percentiles. Despite increased latency values, the products micro-service continues to deliver error-free performance.
Conclusion: At 100 RPS on the deployed server, the products micro-service exhibited noteworthy increases in latency and request durations. However, the maintained error-free performance exemplifies the resilience of the micro-service under high stress. Further tests with incrementally higher RPS will help determine stress limits and identify areas for optimization.

Test Configuration:
One scenario with a thousand virtual users continuously testing all routes for 30 seconds.
Each virtual user sends 1000 RPS by introducing a sleep of 1 second between each request iteration for a total of 1000 requests per sleep period.
Test Results:
Total requests: 18,700, with a 0.00% failure rate.
Latency: Average request duration of 1.68s; 90th percentile at 2.16s, and 95th percentile at 2.24s.
Throughput: 540.501053 requests per second (as each route is tested within the sleep iteration).
With the deployed server tested at 1000 RPS, the following observations are noted:
The average request duration drastically increased to 1.68s compared to the 100 RPS deployed server test (154.45ms), reflecting the added stress on the service.
Latency percentiles also increased significantly: 90th percentile at 2.16s and 95th percentile at 2.24s, demonstrating that response times are impacted as stress levels rise.
Despite the extreme stress, the micro-service maintains a 0.00% error rate, highlighting its robustness and reliability under demanding conditions.
The stress test at 1000 RPS in the deployed server shows a substantial increase in latency and request durations. Even though the performance has degraded under extreme-stress conditions, the error-free performance persists.
Conclusion: The stress test at 1000 RPS on the deployed server revealed that the products micro-service experiences degradation in terms of latency and request durations, but continues to deliver error-free performance. Additional tests with even higher RPS values could help identify the breaking point and areas to optimize the micro-service's performance in a deployed environment.

Test Recap:
One thousand virtual users were set to send 1000 requests per second for 30 seconds.
Results:
The test made 37,516 requests, all successful. Redis caching reduced the average request duration to 758.38ms, a significant improvement. The latency at the 90th and 95th percentiles also decreased, measuring at 826.74ms and 968.11ms. Throughput jumped to 1153.726612 requests per second.
Conclusion:
Redis caching greatly enhanced the performance of the deployed microservice, allowing it to handle a larger load without errors, and decreasing response times.
Next Steps:
Load Balancing: I will focus on implementing a load balancer as it could distribute the traffic more evenly across the server and potentially improve response times further.
In attempting to load balance, I needed to spin up several EC2 instances and repeat all the steps of the first. I could've mitigated this with docker, but I chose local installs for performance, and keeping the ec2 instance as close to the minimum for the free tier as possible. After doing it the second time, I realized I need 9 gb of hard disk space at minimum.
I wrote up a little guide for myself to get it started
1. Update System
sudo apt update && sudo apt upgrade
2. Add PostgreSQL Repository:
wget --quiet -O - https://www.postgresql.org/media/keys/ACCC4CF8.asc | sudo apt-key add -
sudo sh -c 'echo "deb http://apt.postgresql.org/pub/repos/apt $(lsb_release -cs)-pgdg main" > /etc/apt/sources.list.d/pgdg.list'
The first command fetches the repository key with wget and adds it to the apt program keyring so apt trusts the PostgreSQL packages. The second command adds the PostgreSQL apt repository to your system's software repository list.
3. Update again, install psql, & verify installation
sudo apt updatesudo apt install postgresql- In case postgresql is stopped:
sudo systemctl start postgresqlstarts it;sudo systemctl status postgresqlto check statussudo systemctl enable postgresqlto enable service in case it is disabled
4. Add microservice user and create the database
-
sudo -u postgres psql- switches to the postgres user and enter the PostgreSQL shell -
While in shell, create user with create db permission
CREATE USER danny WITH PASSWORD '1234' CREATEDB;SET ROLE danny;- switches to the newly created userCREATE DATABASE mydb;- creates the database\q- exits PostgreSQL Shell
5. Microservice ETL requirements
-
git is needed:
git --version- checks for gitsudo apt install git- in case git is not installed (it should be)
-
Python3 is needed:
python3 --versionsudo apt install python3- in case python is not installed (it should be)
-
pip3 is needed:
sudo apt install python3-pip
-
psycopg2, a PostgreSQL adapter for Python, requires the PostgreSQL development files, namely this one:
sudo apt install libpq-dev
6. Clone down repo & install python reqs (but don't install npm packages yet)
git clone https://github.com/Prim-Tech/overview-service.git- Sign-in and have git key handy
- Create .env file by FTP in /overview-service/ (best to copy local copy)
Install python reqs
cd overview-service/etlpip3 install -r requirements.txt
7. ETL process
Current hard disk usage before ETL df -h
Filesystem      Size  Used Avail Use% Mounted on
/dev/root       8.6G  2.9G  5.7G  34% /
Check RAM usage with watch -n 5 free -m
These must be imported in order and are so named. Each corresponding csv file must be FTP'd into /overview-service/db/data before and then deleted after running each script.
- 1_products.py
- 2_styles.py
- 3_photos.py
- 4_related.py
- 5_features.py
- 6_skus.py
- From /overview-service/ as active directory:
cd db && mkdir datato create the working data foldercd ..to return to active dir- FTP csv file into /overview-service/db/data (note that the related items file had to be modified, see etl/pre_process_related.py)
python3 etl/1_products.py- delete the csv file after successful ETL process
- repeat for each import
- once photos are imported, you're homefree on any potential hard disk issues!
Hard disk usage after ETL df -h
Filesystem      Size  Used Avail Use% Mounted on
/dev/root       8.6G  8.1G  450M  95% /
8. Setup Redis
-
sudo apt install redis-server -
Open the Redis configuration file with a text editor, for example, nano:
sudo nano /etc/redis/redis.conf
-
Find the supervised directive and update it from no to systemd:
- supervised systemd
-
Save and close the file.
CTRL+XthenYthenENTER
-
After making the change, restart the Redis service so the change can take effect:
sudo systemctl restart redis.service
-
Confirm that Redis is working by typing:
redis-cli
-
Then at the prompt try:
- ping
If it returns PONG, then Redis is functioning correctly. Type exit to exit the redis cli
9. Install node/npm
Fetch latest nvm, then Re-open Terminal to confirm installation
curl -o- https://raw.githubusercontent.com/nvm-sh/nvm/v0.39.3/install.sh | bash(as of today's daye)nvm --version
Install node/npm & check versions
nvm install node
...
node -v
npm -v
10. Install & Setup the Micro-service
- From /overview-service/ as active directory:
npm inpm start
If there are no issues, the server should start up correctly with the following
> overview-service@1.0.0 start
> node server/index.js

Server is running on port 3030
Setup Auto-start
-
First, install pm2:
sudo npm install pm2 -g
-
Then, start the app with pm2. Make sure to navigate to the project's directory first:
cd /path/to/overview-service
pm2 start npm --name "overview-service" -- start-
Next, save the current list of processes being managed by pm2. This will allow them to be respawned on startup:
pm2 save
-
Finally, set up the startup script:
pm2 startup systemd
The last command will output a command that you need to run.
[PM2] To setup the Startup Script, copy/paste the following command:
sudo env PATH=$PATH:/usr/bin /usr/local/lib/node_modules/pm2/bin/pm2 startup systemd -u ubuntu --hp /home/ubuntu
After running that command, your app will start on system boot.
[ 'systemctl enable pm2-ubuntu' ]
[PM2] Writing init configuration in /etc/systemd/system/pm2-ubuntu.service
[PM2] Making script booting at startup...
[PM2] [-] Executing: systemctl enable pm2-ubuntu...
Created symlink /etc/systemd/system/multi-user.target.wants/pm2-ubuntu.service → /etc/systemd/system/pm2-ubuntu.service.
[PM2] [v] Command successfully executed.
+---------------------------------------+
[PM2] Freeze a process list on reboot via:
$ pm2 save

[PM2] Remove init script via:
$ pm2 unstartup systemd- Check pm2 status with
pm2 status
- On the primary instance, I ran:
sudo apt update && sudo apt install nginx
- Opened the default NGINX configuration file with nano:
- sudo nano /etc/nginx/nginx.conf
events { }

http {
    upstream backend {
        server localhost:3030;
        server ec2-instance-1-ip:3030;
        server ec2-instance-2-ip:3030;
        server ec2-instance-3-ip:3030;
    }

    server {
        listen 80;

        location / {
            proxy_pass http://backend;
        }
    }
}
- I tested a direct call to each IP:3030 above to test each instance individually
- I tested the config file with the following command:
sudo nginx -t
nginx: the configuration file /etc/nginx/nginx.conf syntax is ok
nginx: configuration file /etc/nginx/nginx.conf test is successful- Restarted NGINX to apply the changes with the command:
sudo systemctl restart nginx
- I edited my security group's inbound rules to allow HTTP from anywhere to port 80
- Finally, I tested one API request to the load balancing instance with the following curl command:
curl http://load-balancer-ip/products
StatusCode        : 200
StatusDescription : OK
Content           : [{"id":1,"name":"Camo Onesie","slogan":"Blend in to your crowd","description":"The So Fatigues will wake
                    you up and fit you in. This high energy camo will have you blending in to even the wildest surr...
RawContent        : HTTP/1.1 200 OK
                    Connection: keep-alive
                    Content-Length: 1322
                    Content-Type: application/json; charset=utf-8
                    Date: Wed, 31 May 2023 21:23:39 GMT
                    ETag: W/"52a-PeYOuGjIkaYZ4xbbXUQa4Fg2VsA"
                    Server: ng...
Forms             : {}
Headers           : {[Connection, keep-alive], [Content-Length, 1322], [Content-Type, application/json; charset=utf-8],
                    [Date, Wed, 31 May 2023 21:23:39 GMT]...}
Images            : {}
InputFields       : {}
Links             : {}
ParsedHtml        : mshtml.HTMLDocumentClass
RawContentLength  : 1322
I ran my original k6 script last used for 1000 rps, with an added check for 200 status codes, using nginx load balancing, and I observed the following:
     ✗ status was 200
      ↳  99% — ✓ 47938 / ✗ 138

     checks.........................: 99.71% ✓ 47938      ✗ 138
     data_received..................: 182 MB 3.0 MB/s
     data_sent......................: 4.5 MB 75 kB/s
     http_req_blocked...............: avg=117.27ms min=0s      med=1.04µs   max=24.05s p(90)=2.98µs   p(95)=397.36ms
     http_req_connecting............: avg=109.65ms min=0s      med=0s       max=24.05s p(90)=0s       p(95)=354.66ms
     http_req_duration..............: avg=486.46ms min=0s      med=34.83ms  max=58.82s p(90)=577.22ms p(95)=1.84s
       { expected_response:true }...: avg=483.98ms min=18.44ms med=34.96ms  max=58.82s p(90)=577.26ms p(95)=1.83s
     http_req_failed................: 0.28%  ✓ 138        ✗ 47938
     http_req_receiving.............: avg=96.68ms  min=0s      med=39.81µs  max=38.26s p(90)=6.31ms   p(95)=36.69ms
     http_req_sending...............: avg=18.47ms  min=0s      med=5.14µs   max=36.26s p(90)=15.31µs  p(95)=28.27µs
     http_req_tls_handshaking.......: avg=0s       min=0s      med=0s       max=0s     p(90)=0s       p(95)=0s
     http_req_waiting...............: avg=371.3ms  min=0s      med=31.94ms  max=58.79s p(90)=465.7ms  p(95)=1.2s
     http_reqs......................: 48076  801.25422/s
     iteration_duration.............: avg=2.7s     min=78.92ms med=412.29ms max=59.14s p(90)=8.15s    p(95)=15.07s
     iterations.....................: 12019  200.313555/s
     successes......................: 47938  798.954255/s
     vus............................: 38     min=38       max=1000
     vus_max........................: 1000   min=1000     max=1000
- Throughput increased by 120%!
- Latency experienced some fluctuations. There were some major hangups in the 95th percentile of almost 2 seconds, with the max req duration doubling from before.
- Overall the average response time decreased; however, errors were introduced. This is probably my fault for not having checked for them before, but they are modestly low at 0.28%
I sought to improve my nginx config with the following:
worker_processes auto;

events {
    worker_connections 4096; # Increase to handle more connections
    multi_accept on;
    use epoll;
}

http {
    upstream backend {
        least_conn;
        keepalive 64; # Increase keepalive connections
        server localhost:3030 weight=2;
        server 34.238.44.32:3030;
        server 54.174.93.192:3030;
        server 3.83.134.22:3030;
    }

    server {
        listen 80 backlog=8192; # Increase the backlog queue

        location / {
            proxy_pass http://backend;
            proxy_http_version 1.1;
            proxy_set_header Connection "";
            proxy_buffering on; # Enable buffering
            proxy_buffers 16 32k; # Increase the number and size of buffers
            proxy_busy_buffers_size 64k; # Increase the size of busy buffers
            client_max_body_size 100m; # Increase the client body size limit
        }
    }
}
-
worker_connections was increased to 4096. This allows more simultaneous connections.
-
keepalive was increased to 64. This allows more keepalive connections to the backend servers.
-
backlog was increased in the listen directive. This increases the backlog queue, which can handle more connections.
-
proxy_buffering was set to on. This enables buffering, which can improve performance when the client connection is slower than the backend connection.
-
proxy_buffers and proxy_busy_buffers_size are increased. This allows Nginx to buffer more data, which can improve performance.
-
client_max_body_size was increased to 100m. This allows clients to upload larger files.
-
weight to server 1: I added some weight to my first ec2 instance since it has more hard disk space, about 4gb more "room to breathe" than the other servers (10 gb)
Running the same test as before, I observed the following
✗ status was 200
      ↳  98% — ✓ 114679 / ✗ 1389

     checks.........................: 98.80% ✓ 114679      ✗ 1389
     data_received..................: 436 MB 9.4 MB/s
     data_sent......................: 11 MB  230 kB/s
     http_req_blocked...............: avg=37.25ms  min=0s      med=1.25µs  max=24.13s p(90)=2.63µs   p(95)=4.08µs
     http_req_connecting............: avg=37.24ms  min=0s      med=0s      max=24.13s p(90)=0s       p(95)=0s
     http_req_duration..............: avg=225.1ms  min=0s      med=53.04ms max=44.58s p(90)=337.29ms p(95)=582.96ms
       { expected_response:true }...: avg=224.1ms  min=17.86ms med=53.36ms max=44.58s p(90)=336.41ms p(95)=574.64ms
     http_req_failed................: 1.19%  ✓ 1389        ✗ 114679
     http_req_receiving.............: avg=24.84ms  min=0s      med=34.68µs max=16.28s p(90)=23.29ms  p(95)=56.53ms
     http_req_sending...............: avg=10.89µs  min=0s      med=5.84µs  max=2.96ms p(90)=11.34µs  p(95)=19.55µs
     http_req_tls_handshaking.......: avg=0s       min=0s      med=0s      max=0s     p(90)=0s       p(95)=0s
     http_req_waiting...............: avg=200.24ms min=0s      med=48.45ms max=44.53s p(90)=321.15ms p(95)=526.14ms
     http_reqs......................: 116068 2490.169482/s
     iteration_duration.............: avg=1.08s    min=76.55ms med=264.6ms max=46.48s p(90)=1.74s    p(95)=5.16s
     iterations.....................: 29017  622.54237/s
     successes......................: 114679 2460.369318/s
     vus............................: 12     min=12        max=1000
     vus_max........................: 1000   min=1000      max=1000
- Throughput more than doubled by 244%! 114679 requests were made with 2460.369318 RPS
- Latency lowered overall from the first test, with no major hangups in the upper percentiles
- Error rate went up; given the amount of requests, it seems reasonably low for the throughput and latency
I concede that the test I've been running with is unrealistic, as it only calls the default page/count for the products endpoint multiple times over, so I decided to start testing with random variables
The script is generaly the same but will now generate a random page number and a count value. As suggested in learn, there's a bias towards the last 10% of the pages with a 10% probability.
I ran many iterations of the script, trying to improve the RPS as I could not dramatically increase it without introducing major latency or error rates
These script options netted the best results for varying page numbers for the products endpoint with the bias indicated { duration: '100s', target: 100 }, // ramp up to 100 users { duration: '160s', target: 150 }, // stay at 100 users { duration: '100s', target: 100 }, // ramp down to 0 users
Compared to my other routes, this is the only one that does not benefit from indexing, and it really shows in the following:
 ✓ http response status code is 200

     checks.........................: 100.00% ✓ 24736     ✗ 0
     data_received..................: 50 MB   137 kB/s
     data_sent......................: 2.6 MB  7.2 kB/s
     http_req_blocked...............: avg=329.63µs min=483ns   med=1.52µs max=1.09s    p(90)=2.53µs  p(95)=3.64µs
     http_req_connecting............: avg=326.9µs  min=0s      med=0s     max=1.09s    p(90)=0s      p(95)=0s
     http_req_duration..............: avg=1.52s    min=18.37ms med=1.3s   max=8.8s     p(90)=3.28s   p(95)=3.95s
       { expected_response:true }...: avg=1.52s    min=18.37ms med=1.3s   max=8.8s     p(90)=3.28s   p(95)=3.95s
     http_req_failed................: 0.00%   ✓ 0         ✗ 24736
     http_req_receiving.............: avg=65µs     min=10.8µs  med=55µs   max=1.64ms   p(90)=95.36µs p(95)=113.61µs
     http_req_sending...............: avg=10.34µs  min=3.16µs  med=7.1µs  max=293.43µs p(90)=23.42µs p(95)=26.98µs
     http_req_tls_handshaking.......: avg=0s       min=0s      med=0s     max=0s       p(90)=0s      p(95)=0s
     http_req_waiting...............: avg=1.52s    min=18.3ms  med=1.3s   max=8.8s     p(90)=3.28s   p(95)=3.95s
     http_reqs......................: 24736   68.135754/s
     iteration_duration.............: avg=1.52s    min=18.49ms med=1.3s   max=8.81s    p(90)=3.28s   p(95)=3.95s
     iterations.....................: 24736   68.135754/s
     vus............................: 2       min=1       max=150
     vus_max........................: 150     min=150     max=150
Latency is much higher in a realistic scenario, but reasonable with a response time lower than 2000 ms. With the provided settings, no errors are experienced, and the RPS stays consistently above 60 RPS; however, I can't raise the RPS in a realistic scenario without compromising heavily on latency and error rates.
As mentioned before, this route does not benefit from indexing at all since it uses a standard query for pagination, which does not involve id lookup. My research also shows that the OFFSET method, which is often used for pagination, could get slower as we navigate to higher page numbers.


After much deliberation, I sought to improve this query by pre-caching the last ID for every 5-count page, as 5 is the default, and we can assume for the purposes of paginating products, 5 count will be the most efficient retrieval.
EXPLAIN ANALYZE SELECT * FROM products LIMIT 5 OFFSET 158923;

EXPLAIN ANALYZE SELECT * FROM products LIMIT 5 OFFSET 199358;

This confirms my research about slower query time as we navigate to higher page numbers.
EXPLAIN ANALYZE
SELECT * FROM products
WHERE id > 996790
ORDER BY id
LIMIT 5;

The query execution time is a fraction of what it was!!
redis-cli log: 1685720593.640494 [0 127.0.0.1:52486] "SET" "products:lastId:199354:5" "996770"
Note that the offset === (page - 1) * count
(199354 - 1) * 5 = 996765
SELECT * FROM products LIMIT 5 OFFSET 996765;
EXPLAIN ANALYZE
SELECT * FROM products
WHERE id > 996765
ORDER BY id
LIMIT 5;
- I did not get the expected results, i suspect this is because the order can't be maintained of the table, so i ran
CLUSTER products USING products_id_idx;according to a Stack Overflow post.- This gave me ordered results upon querying the db, but upon querying again, they were out of order again. According to my research, postgresql can never guarantuee order except by explicitly setting
ORDER BYin the query. The problem is, doing so with my original query makes it read the db even longer (1500ms).
- This highlights something I missed early on, and presents an opportunity to optimize the call regardless of the count
- I confirmed with the legacy API that it also returns products in order
      const { page = 1, count = 5 } = req.query;
      const lastIdKey = `products:lastId:${page}:${count}`;
      const key = `products:${page}:${count}`;

      try {
        let products = await client.get(key);
        let lastId = Math.max(+(await client.get(lastIdKey)) - 5, 0);

        if (!lastId) {
          lastId = (page - 1) * count;
        }
        if (products) {
          return res.status(200).json(JSON.parse(products));
        } else {
          const result = await pool.query(
            `
            SELECT * FROM products
            WHERE id > $1
            ORDER BY id
            LIMIT $2
            `,
            [lastId, count]
          );

          await client.set(key, JSON.stringify(result.rows), 'EX', 3600);
          await client.set(lastIdKey, (result.rows[result.rows.length - 1].id));
          return res.status(200).json(result.rows);
        }
      } catch (error) {
        return res.status(500).send(error);
      }
- Since the IDs are sequential from 1 to 1,000,011, I can use the new query for all scenarios regardless of page or count
- I have already pre-cached ids for all 5 count queries, so no injury there


It seems the current setup starts reaching a breaking point at 1,500 RPS (this holds true for all routes at these speeds)

Sign up for free
to join this conversation on GitHub.
Already have an account?
Sign in to comment