- This paper proposes a new method for the analysis and classification of driver behavior using a selected(extracted) subset of CAN bus signals, specifically gas pedal position, brake pedal pressure, steering wheel angle, steering wheel momentum, velocity, RPM, frontal and lateral acceleration.
- they propose an unsupervised learning technique that clusters drivers in different groups, and offers a validation method to test the robustness of clustering in a wide range of experimental settings. The minimal amount of data needed to preserve robust driver clustering is also computed.
- data carried out by a AUDI AG.
- involved 64 different drivers, who have not instructed the road route. Total of 55 days experiments.
- Total of 2135 hrs of driving data for each of the 2418 sensors have been acquired. CAN bus signal were recorded. Out of 2418 signals recorded by CAN bus this research concentrated in 8 signals:
- Brake pedal pressure
- Gas pedal pressure
- Revolution per minute
- Speed
- Steering wheel angle
- Steering wheel momentum
- Frontal Accelerator
- Lateral accelerator
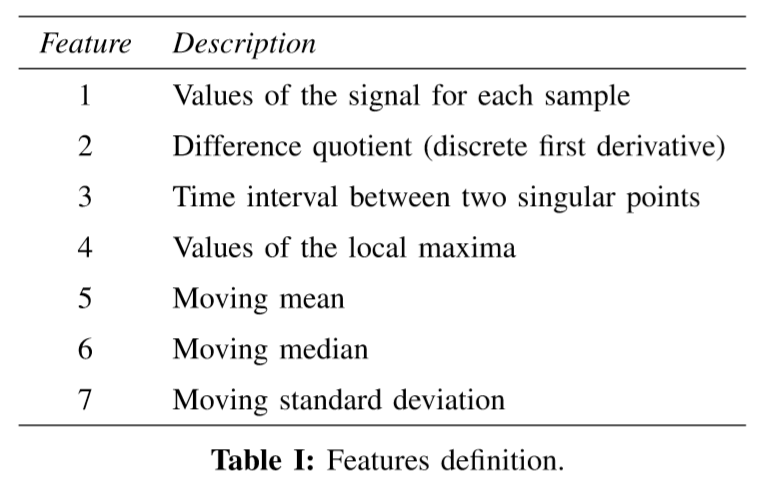
- Each signal are paired with a timestamp. denote as (xi,tix_i, t_ixi,ti). Where xix_ixi is the data point and tit_iti For each signal these following field are computed.
- technique: Plot a histogram of the sampled data on 4 signals. Chop the front and tail of the histogram.
- Split data into 10 bin(10 class). Plot the histogram of the data. Split the histogram into 10 part equally. Each part get assign to a class.
- Principle component analysis data reduction technique is use to reduce dimension from 10d -> 2d.
- Now each data will represent as (1 x 8 x 2) where 1 is one data point. 8 is the 8 sensor values and 2 is the reduce dimension of each.
- The idea is that data generated by the CAN bus in real time is huge. This is almost infeasible to sampling all data from the bus.
- Since the training data is hugh, The Researcher suggest to use contiguous sampling or choose a random(acutally random) an interval and start sampling the data.
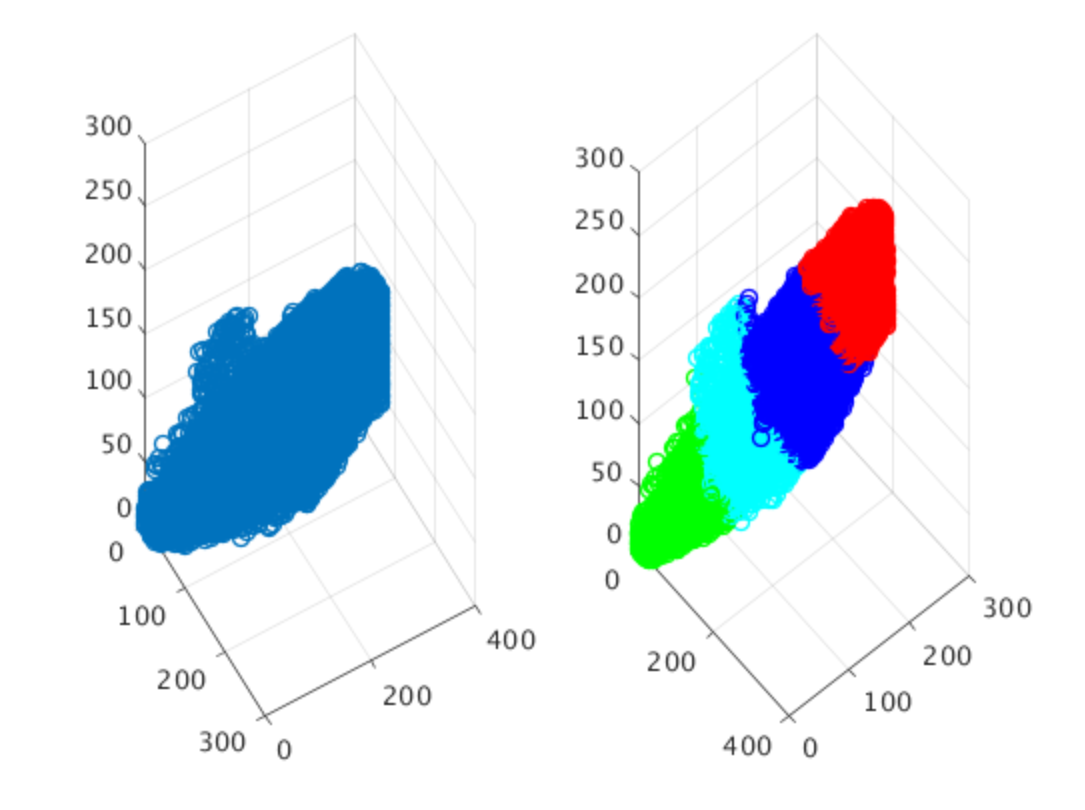
- Kmean clustering to cluster data. k here is the number of class. The idea is of this algorithm is to plot each data in a space and find the mean of each. Pictures below show a clear visualization of the algorithm. Note: picture below is not from the research paper. Picture left describe the data cloud. and pictures on the right is the mean of each class that algorithm clustered.
- Data is divided into trainingset(70%) and validation set(30%). K-mean cluster algorithm is performed on both train and validation set. Best case scenario, on both train and validation set, mean of each class cluster(data cloud) should be the same. These two clustering are then compared using a metric called “V-measure”, a score ranging from 0 to 1. measure how mean of clusters in both set far apart.
- Since this work involve Unsupervised learning process, where model try to learn the unique pattern in the data. Therefore, accuracy is irrelvant. In this case, k parameter in K-mean algorithm is set to be 4. This indicate that K-mean algorithm will cluster out 4 unique class in the data cloud.