This is my series of articles covering short "Today I learned" topics as I work with CockroachDB. Today, we're finding partial indexes, identifying the DB Console URL with SQL, experimenting with a light weight pooler called pgcat, handling client disconnects and improving UX with PGSERVICEFILE
- Volume 1
- Volume 2
- Volume 3
- Volume 4
- Volume 5
- Volume 6
- Volume 7
- Volume 8
- Volume 9
- Volume 10
- Volume 11
- Topic 1: Identify partial indexes
- Topic 2: Capture the DB Console URL with SQL
- Topic 3: Experimenting with
pgcat - Topic 4: CockroachDB and
pgbenchclient disconnects - Topic 5: CockroachDB and
PGSERVICEFILE
Our engineering team has issued a technical advisory #96924 where certain schema changes like dropping columns referenced in partial indexes will fail. A customer asks how to identify databases, tables and the associated partial indexes referencing columns to be dropped. The following methods will assist in finding those pesky indexes.
Considering a table with the following data:
       productid      | count
----------------------+--------
   124529279008768012 |    10
   269379767096311819 |     1
  3933583925262417931 |     1
  5235926712347525131 |    10
  6063452847229632523 |     1
Assume a query like SELECT productid, count FROM demo_partial WHERE count >=10 and count < 100; is executed fairly frequently, a partial index like below can speed up the query.
CREATE INDEX ON demo_partial (count) STORING (productid) WHERE count >= 10 and count < 100;Looking at the plan
EXPLAIN SELECT productid, count FROM demo_partial WHERE count >=10 and count < 100; info
----------------------------------------------------------------
distribution: local
vectorized: true
• scan
missing stats
table: demo_partial@demo_partial_count_idx (partial index)
spans: FULL SCANTo identify an index in the current database's context, you'd use a query like below
 SELECT schemaname, tablename, indexname
  FROM pg_index JOIN pg_indexes ON (indexrelid = crdb_oid)
 WHERE indpred IS NOT NULL;
schemaname | tablename | indexname
-------------+--------------+-------------------------
public | demo_partial | demo_partial_count_idxIf you'd like to identify a specific database outside the context of the current database, you'd have to include the <database name>.<pg_catalog> in the JOIN condition
 SELECT schemaname, tablename, indexname
  FROM system.pg_catalog.pg_index JOIN system.pg_catalog.pg_indexes ON (indexrelid = crdb_oid)
 WHERE indpred IS NOT NULL;
schemaname | tablename | indexname
-------------+-----------+---------------------
public | jobs | jobs_run_stats_idxThe reason I am looking at a system table it's because that's the only other place where I have a partial index. I know this because the query below can be useful to identify all partial indexes across all databases.
 SELECT (SELECT name FROM crdb_internal.databases WHERE id = "parentID"),
       "parentSchemaID"::REGNAMESPACE::STRING AS schema_name,
       name,
       index_name
  FROM system.namespace JOIN "".crdb_internal.table_indexes ON (id = descriptor_id)
 WHERE create_statement LIKE '%WHERE%';
name | schema_name | name | index_name
---------+-------------+--------------+-------------------------
demo | public | demo_partial | demo_partial_count_idx
system | public | jobs | jobs_run_stats_idxFinally, it is not the case for the cluster I'm on because the cluster version not impacted by the technical advisory. That said, I can safely issue the drop column command and it will not fail!
ALTER TABLE demo_partial DROP COLUMN count;CockroachDB is designed to scale horizontally and with a multi-node architecture come many challenges. In this case, we're talking about the observability and monitoring. When you manage a fleet of CockroachDB nodes, how do you hone in on the right metrics and go to the right place? A quick way to identify the DB Console UI when you run a large fleet with SQL can be done with the query below. It can return a URL of the DB Console per node:
SELECT value
  FROM crdb_internal.node_runtime_info
WHERE node_id = 1
      AND component = 'UI'
      AND field = 'URL';
On my local demo instance it returns
http://127.0.0.1:8080On my multiregion cluster it returns
http://18.215.34.53:26258It's worth mentioning that it only works for the node you're connected to in the SQL shell. It won't return anything if you're trying to access URL of another node. That said, node_id predicate is not necessary.
Today, I'd like to briefly look at pgcat, which describes itself as a "PostgreSQL pooler and proxy (like PgBouncer) with support for sharding, load balancing, failover and mirroring". I will leave a deep dive of pgcat for another time as I think there are many avenues we can take with this but TLDR: it's a pooler written in Rust and it is meant to work similarly to PGBouncer. My first impressions are that it is very simple to get started with, something I cannot say about PGBouncer. It can work as a stateless SQL proxy and I will touch on that in a separate article but I've given it enough attention confirming it works with CockroachDB, at least in insecure mode. All in all, I'm impressed with its simplicity, I was able to get it up and running in a matter of an hour. I do have a functioning docker compose environment, feel free to give it a try.
The first thing you notice is it works out of the box with pgbench. In fact, the README encourages to use pgbench for the testing. The only hurdle I've faced with pgbench and pgcat combined is that pgcat expects a password. In my pgbench container, I set an environment variable for a dummy password, even though CockroachDB doesn't even check it.
    environment:
      - PGHOST=pgcat
      - PGUSER=root
      - PGPASSWORD=dummy
      - PGPORT=6432
      - PGDATABASE=example
      - SCALE=10
After the initial setup, we can initialize the workload. At the most basic level you need the host pgcat, the port 6432, the database example and --no-vacuum flag to initialize pgbench with CockroachDB.
pgbench -i -h pgcat -p 6432 --no-vacuum exampledropping old tables...
creating tables...
NOTICE: storage parameter "fillfactor" is ignored
NOTICE: storage parameter "fillfactor" is ignored
NOTICE: storage parameter "fillfactor" is ignored
generating data (client-side)...
100000 of 100000 tuples (100%) done (elapsed 0.01 s, remaining 0.00 s)
creating primary keys...
done in 3.50 s (drop tables 0.10 s, create tables 0.03 s, client-side generate 1.90 s, primary keys 1.46 s).Then we can run the workload
pgbench -t 1000 -p 6432 -h pgcat --no-vacuum --protocol simplepgbench (15.1 (Debian 15.1-1.pgdg110+1), server 13.0.0)
transaction type: <builtin: TPC-B (sort of)>
scaling factor: 1
query mode: simple
number of clients: 1
number of threads: 1
maximum number of tries: 1
number of transactions per client: 1000
number of transactions actually processed: 1000/1000
number of failed transactions: 0 (0.000%)
latency average = 10.080 ms
initial connection time = 0.691 ms
tps = 99.208672 (without initial connection time)pgbench -t 1000 -p 6432 -h pgcat --no-vacuum --protocol extendedpgbench (15.1 (Debian 15.1-1.pgdg110+1), server 13.0.0)
transaction type: <builtin: TPC-B (sort of)>
scaling factor: 1
query mode: extended
number of clients: 1
number of threads: 1
maximum number of tries: 1
number of transactions per client: 1000
number of transactions actually processed: 1000/1000
number of failed transactions: 0 (0.000%)
latency average = 12.231 ms
initial connection time = 1.261 ms
tps = 81.758842 (without initial connection time)The logging is verbose, feel free to disable it in the compose file.
[2023-04-18T14:19:35.748339Z INFO  pgcat] Welcome to PgCat! Meow. (Version 1.0.1)
[2023-04-18T14:19:35.751893Z INFO  pgcat] Running on 0.0.0.0:6432
[2023-04-18T14:19:35.751908Z INFO  pgcat::config] Ban time: 60s
[2023-04-18T14:19:35.751910Z INFO  pgcat::config] Idle client in transaction timeout: 0ms
[2023-04-18T14:19:35.751911Z INFO  pgcat::config] Worker threads: 4
[2023-04-18T14:19:35.751911Z INFO  pgcat::config] Healthcheck timeout: 1000ms
[2023-04-18T14:19:35.751913Z INFO  pgcat::config] Connection timeout: 5000ms
[2023-04-18T14:19:35.751913Z INFO  pgcat::config] Idle timeout: 60000ms
[2023-04-18T14:19:35.751914Z INFO  pgcat::config] Log client connections: false
[2023-04-18T14:19:35.751915Z INFO  pgcat::config] Log client disconnections: false
[2023-04-18T14:19:35.751916Z INFO  pgcat::config] Shutdown timeout: 60000ms
[2023-04-18T14:19:35.751917Z INFO  pgcat::config] Healthcheck delay: 30000ms
[2023-04-18T14:19:35.751918Z INFO  pgcat::config] TLS support is disabled
[2023-04-18T14:19:35.751919Z INFO  pgcat::config] [pool: tpcc] Maximum user connections: 30
[2023-04-18T14:19:35.751921Z INFO  pgcat::config] [pool: tpcc] Default pool mode: session
[2023-04-18T14:19:35.751922Z INFO  pgcat::config] [pool: tpcc] Load Balancing mode: Random
[2023-04-18T14:19:35.751923Z INFO  pgcat::config] [pool: tpcc] Connection timeout: 5000ms
[2023-04-18T14:19:35.751923Z INFO  pgcat::config] [pool: tpcc] Idle timeout: 60000ms
[2023-04-18T14:19:35.751925Z INFO  pgcat::config] [pool: tpcc] Sharding function: pg_bigint_hash
[2023-04-18T14:19:35.751926Z INFO  pgcat::config] [pool: tpcc] Primary reads: true
[2023-04-18T14:19:35.751927Z INFO  pgcat::config] [pool: tpcc] Query router: true
[2023-04-18T14:19:35.751928Z INFO  pgcat::config] [pool: tpcc] Number of shards: 3
[2023-04-18T14:19:35.751929Z INFO  pgcat::config] [pool: tpcc] Number of users: 1
[2023-04-18T14:19:35.751931Z INFO  pgcat::config] [pool: tpcc][user: root] Pool size: 30
[2023-04-18T14:19:35.751932Z INFO  pgcat::config] [pool: tpcc][user: root] Statement timeout: 0
[2023-04-18T14:19:35.751933Z INFO  pgcat::config] [pool: tpcc][user: root] Pool mode: session
[2023-04-18T14:19:35.751934Z INFO  pgcat::config] [pool: example] Maximum user connections: 30
[2023-04-18T14:19:35.751935Z INFO  pgcat::config] [pool: example] Default pool mode: session
[2023-04-18T14:19:35.751936Z INFO  pgcat::config] [pool: example] Load Balancing mode: Random
[2023-04-18T14:19:35.751937Z INFO  pgcat::config] [pool: example] Connection timeout: 5000ms
[2023-04-18T14:19:35.751939Z INFO  pgcat::config] [pool: example] Idle timeout: 60000ms
[2023-04-18T14:19:35.751940Z INFO  pgcat::config] [pool: example] Sharding function: pg_bigint_hash
[2023-04-18T14:19:35.751941Z INFO  pgcat::config] [pool: example] Primary reads: true
[2023-04-18T14:19:35.751942Z INFO  pgcat::config] [pool: example] Query router: true
[2023-04-18T14:19:35.751943Z INFO  pgcat::config] [pool: example] Number of shards: 3
[2023-04-18T14:19:35.751944Z INFO  pgcat::config] [pool: example] Number of users: 1
[2023-04-18T14:19:35.751945Z INFO  pgcat::config] [pool: example][user: root] Pool size: 30
[2023-04-18T14:19:35.751947Z INFO  pgcat::config] [pool: example][user: root] Statement timeout: 0
[2023-04-18T14:19:35.751948Z INFO  pgcat::config] [pool: example][user: root] Pool mode: session
[2023-04-18T14:19:35.751984Z INFO  pgcat::pool] [pool: tpcc][user: root] creating new pool
[2023-04-18T14:19:35.752011Z INFO  pgcat::prometheus] Exposing prometheus metrics on http://0.0.0.0:9930/metrics.
[2023-04-18T14:19:35.752063Z INFO  pgcat::pool] [pool: example][user: root] creating new pool
[2023-04-18T14:19:35.752116Z INFO  pgcat] Config autoreloader: 15000 ms
[2023-04-18T14:19:35.752143Z INFO  pgcat] Waiting for clients
[2023-04-18T14:19:35.752931Z INFO  pgcat::pool] Creating a new server connection Address { id: 3, host: "lb", port: 26000, shard: 0, database: "example", role: Primary, replica_number: 0, address_index: 0, username: "root", pool_name: "example", mirrors: [], stats: AddressStats { total_xact_count: 0, total_query_count: 0, total_received: 0, total_sent: 0, total_xact_time: 0, total_query_time: 0, total_wait_time: 0, total_errors: 0, avg_query_count: 0, avg_query_time: 0, avg_recv: 0, avg_sent: 0, avg_errors: 0, avg_xact_time: 0, avg_xact_count: 0, avg_wait_time: 0 } }
[2023-04-18T14:19:35.752952Z INFO  pgcat::pool] Creating a new server connection Address { id: 4, host: "lb", port: 26000, shard: 1, database: "example", role: Primary, replica_number: 0, address_index: 0, username: "root", pool_name: "example", mirrors: [], stats: AddressStats { total_xact_count: 0, total_query_count: 0, total_received: 0, total_sent: 0, total_xact_time: 0, total_query_time: 0, total_wait_time: 0, total_errors: 0, avg_query_count: 0, avg_query_time: 0, avg_recv: 0, avg_sent: 0, avg_errors: 0, avg_xact_time: 0, avg_xact_count: 0, avg_wait_time: 0 } }
[2023-04-18T14:19:35.752950Z INFO  pgcat::pool] Creating a new server connection Address { id: 5, host: "lb", port: 26000, shard: 2, database: "example", role: Primary, replica_number: 0, address_index: 0, username: "root", pool_name: "example", mirrors: [], stats: AddressStats { total_xact_count: 0, total_query_count: 0, total_received: 0, total_sent: 0, total_xact_time: 0, total_query_time: 0, total_wait_time: 0, total_errors: 0, avg_query_count: 0, avg_query_time: 0, avg_recv: 0, avg_sent: 0, avg_errors: 0, avg_xact_time: 0, avg_xact_count: 0, avg_wait_time: 0 } }
I will continue my experiments with pgcat. If you'd like to see a specific scenario using pgcat and CockroachDB, feel free to share your feedback in the comments.
I was presenting a CockroachDB fault tolerance demo to a prospect and I needed to demonstrate how client applications handle node failures and restarts. In this particular case, I opted for a pgbench client instead of the common CockroachDB workload. The goal was to show that in the face of node failures, client applications can continue uninterrupted. Of course you have to practice defensible practices but otherwise clients should be unimpacted in most cases. When a node failure occurs, the worst case scenario is for an in-flight transaction to retry and app itself should not exit. In this particular case, pgbench is actually unable to handle a graceful node restart and the app exits.
Below, I am using the most common featurs of pgbench for a reasonable CockroachDB workload. I am handling retries thanks to the new pgbench capabilities and I'm also using a CockroachDB derivative of TPC-B workload that handles retries implicitly.
pgbench \
    --host=${PGHOST} \
    --no-vacuum \
    --file=tpcb-cockroach.sql@1 \
    --client=8 \
    --jobs=8 \
    --username=${PGUSER} \
    --port=${PGPORT} \
    --scale=10 \
    --failures-detailed \
    --verbose-errors \
    --max-tries=3 \
    --protocol simple \
    ${PGDATABASE} \
    -T 3600 \
    -P 5
I am using pgcat with session pool mode, in which connections are retained for the entirety of the session. It means that once client disconnects, we have to re-establish a session on the given connection. Unfortunately, CockroachDB does not work with transaction pool mode as there are issues with prepared statements currently.
I can now start shutting down the nodes to demonstrate the problem.
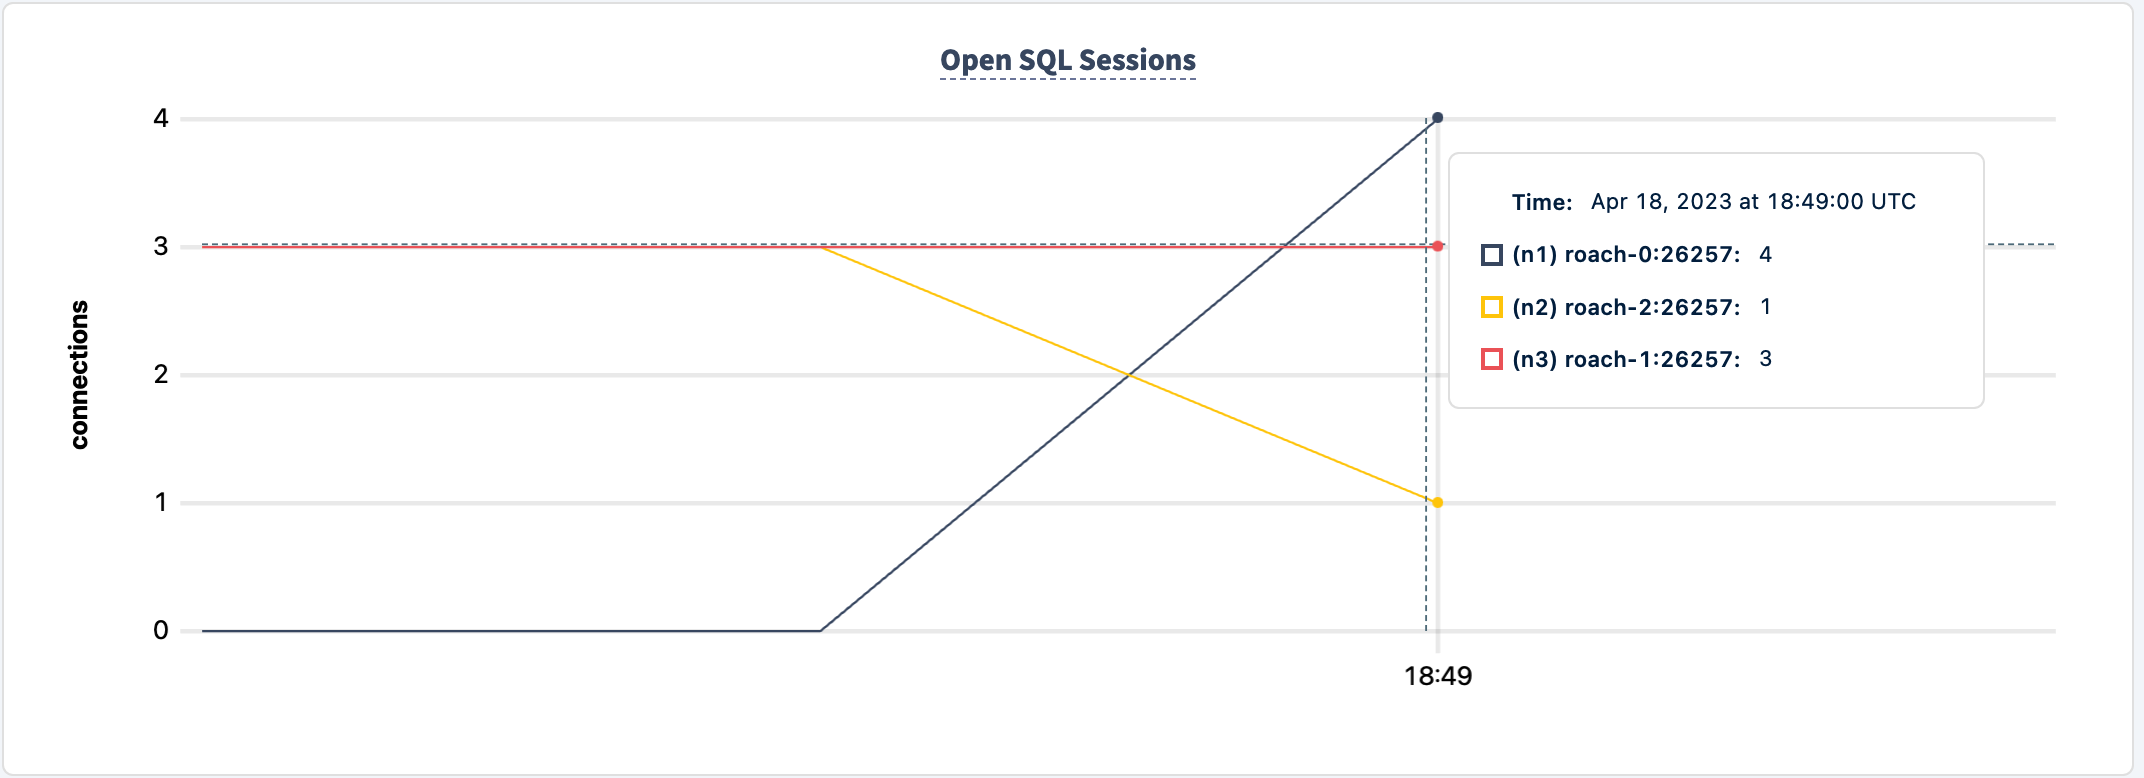
I am going to shut down node n2 as it has the least amount of connections, although in the real world there is unfortunatley no choice when a failure hits.
progress: 75.0 s, 388.0 tps, lat 20.693 ms stddev 25.983, 0 failed, 0 retried, 0 retries
progress: 80.0 s, 360.0 tps, lat 22.213 ms stddev 26.625, 0 failed, 0 retried, 0 retries
pgbench: error: client 6 script 0 aborted in command 4 query 0: FATAL:  error receiving data from server: SocketError("Error reading message code from socket - Error Kind(UnexpectedEof)")
server closed the connection unexpectedly
        This probably means the server terminated abnormally
        before or while processing the request.
progress: 85.0 s, 374.2 tps, lat 19.953 ms stddev 22.712, 0 failed, 0 retried, 0 retries
progress: 90.0 s, 415.8 tps, lat 16.842 ms stddev 20.892, 0 failed, 0 retried, 0 retries
In this case we were really lucky that even though we've been impacted, the client continues processing the workload.
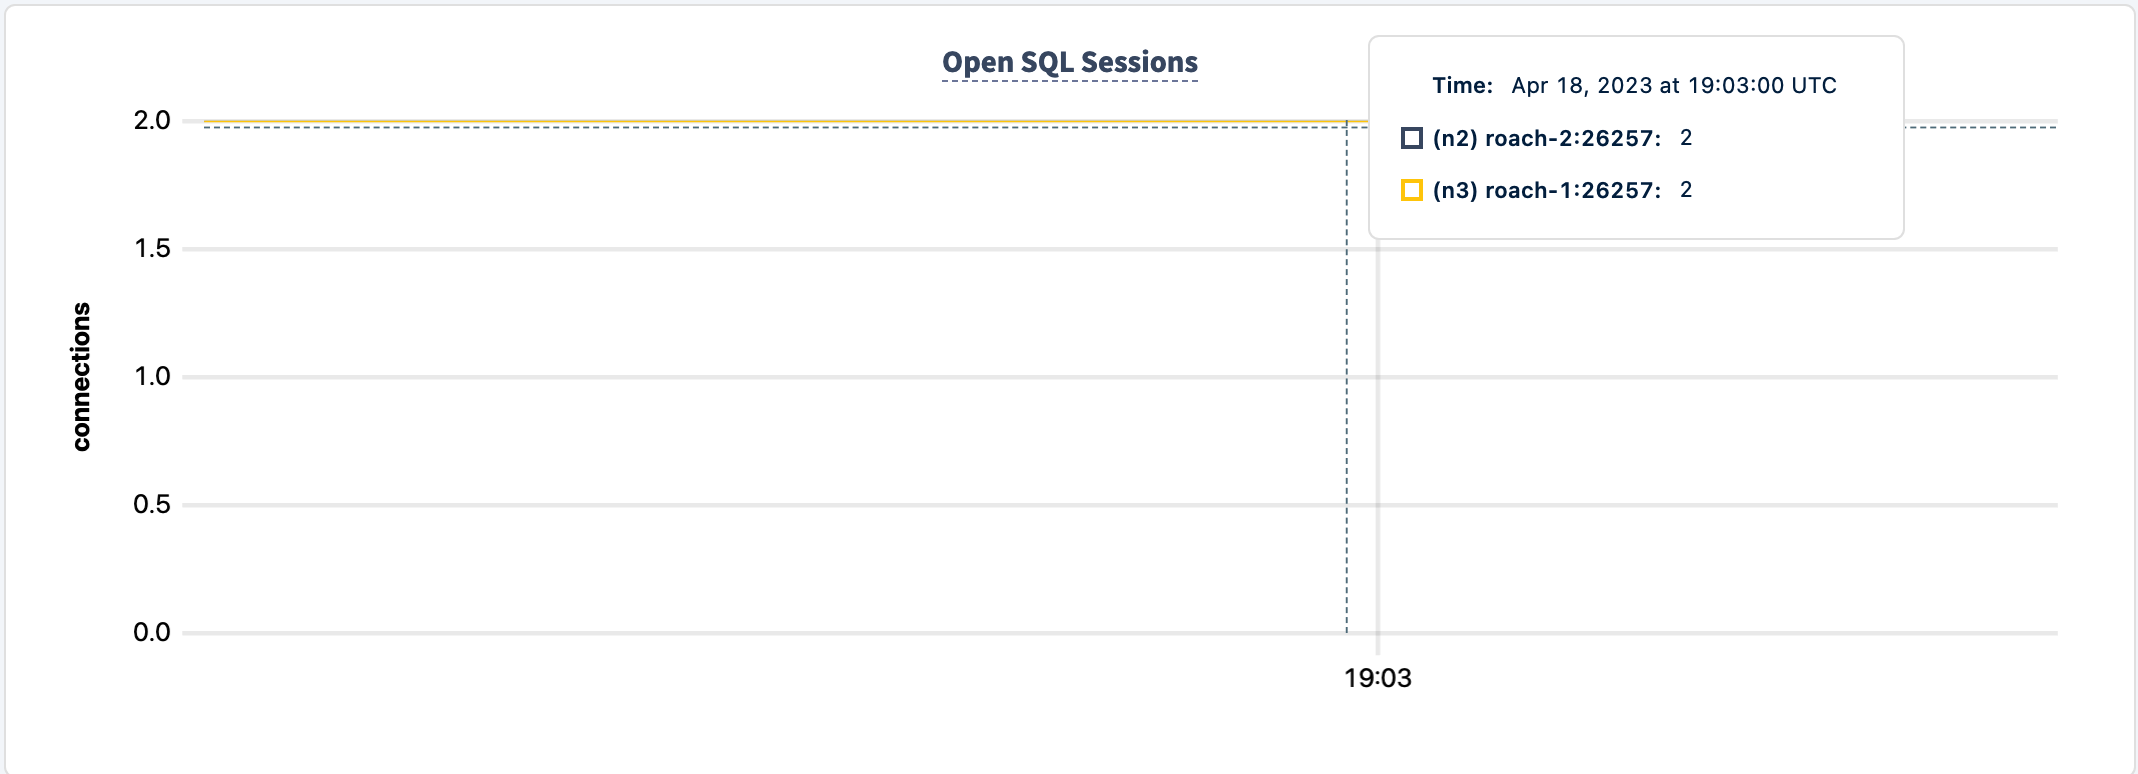
With node n2 down, the connection graph only shows two nodes
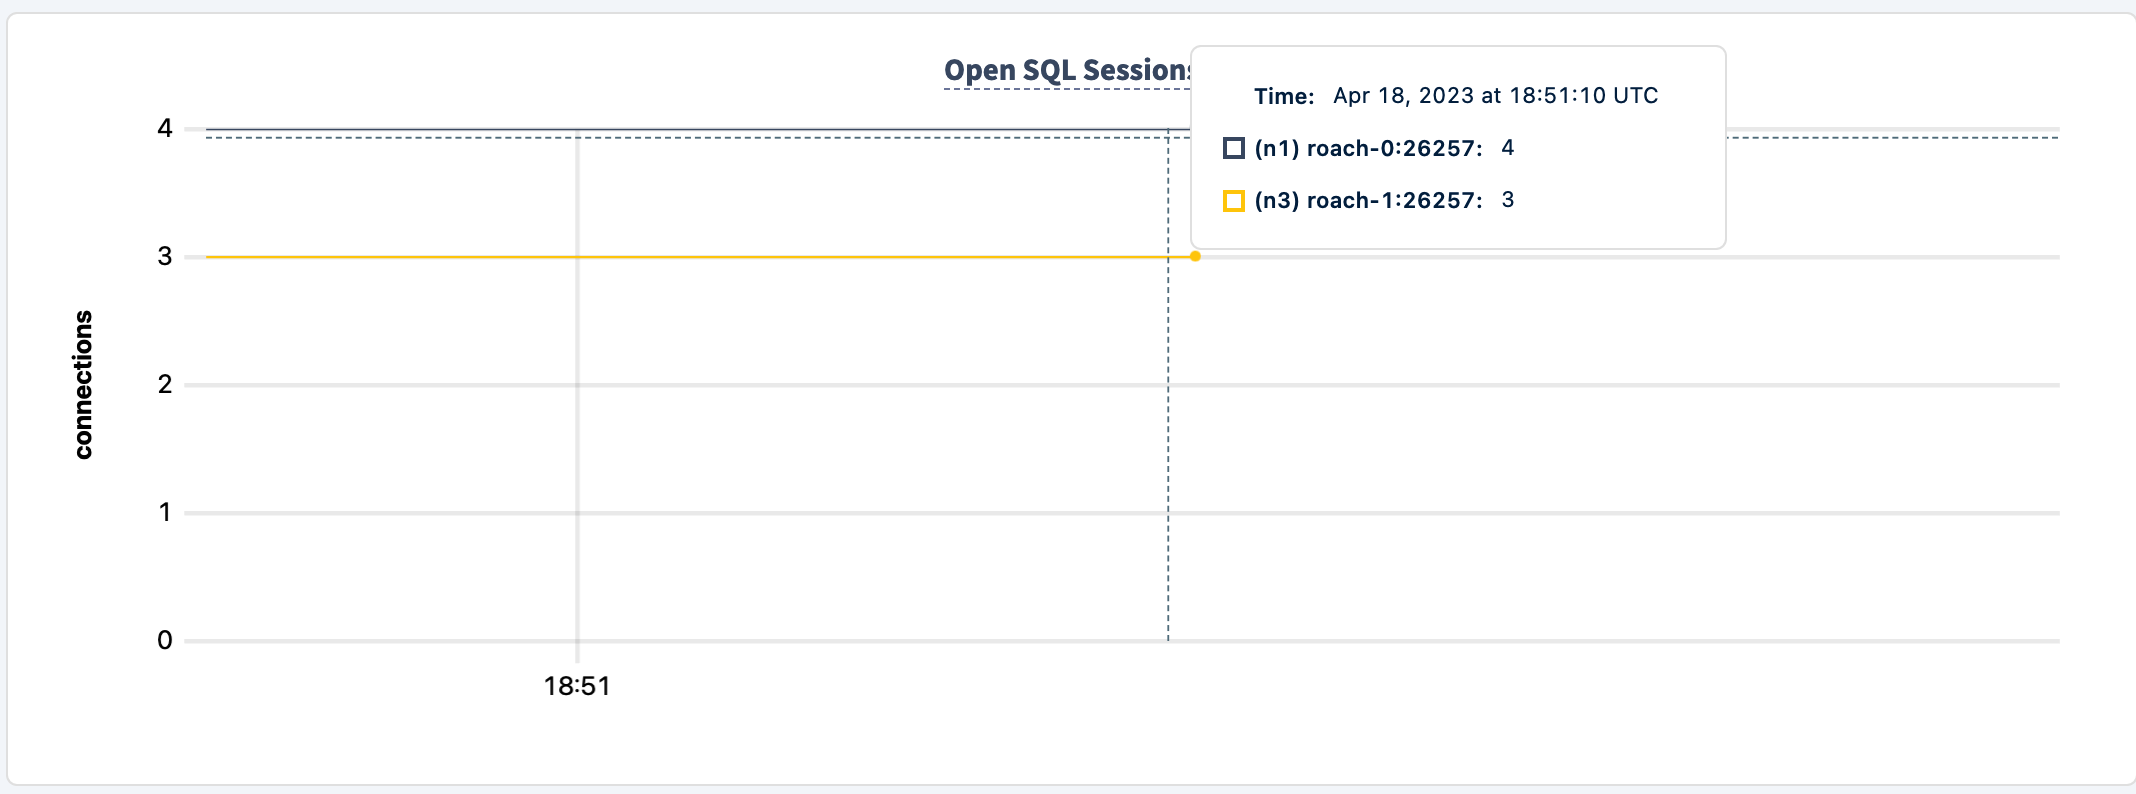
Let's bring it back up
The workload is still running but it is not routing new traffic to n2.
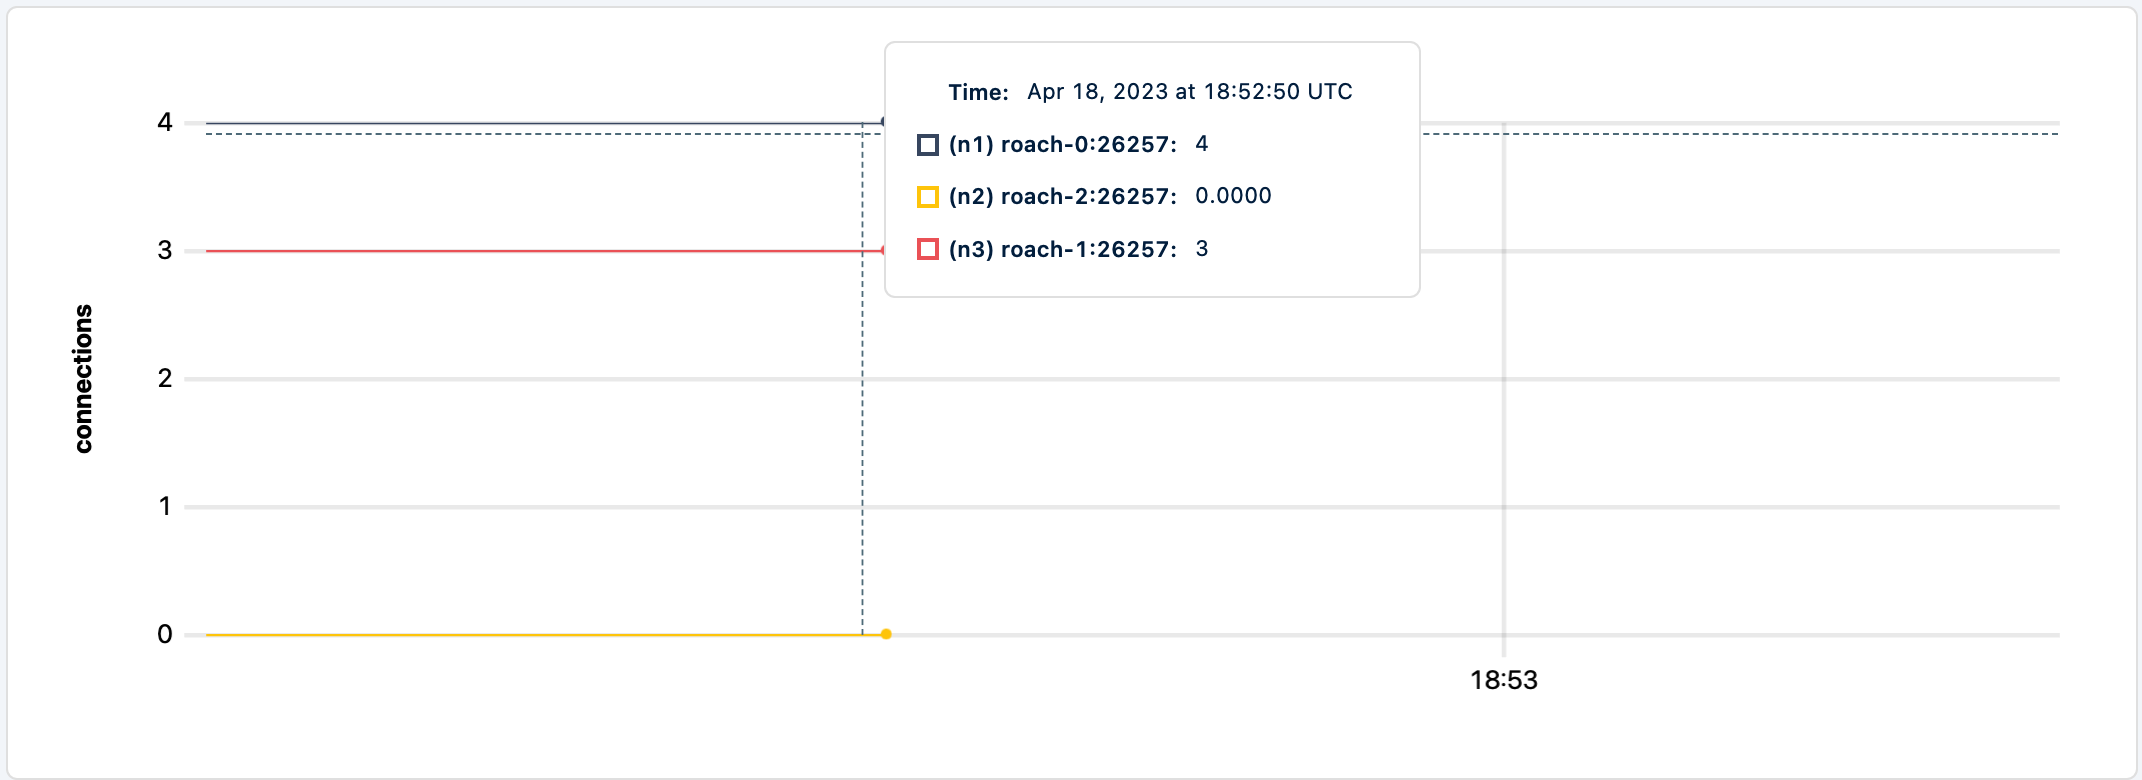
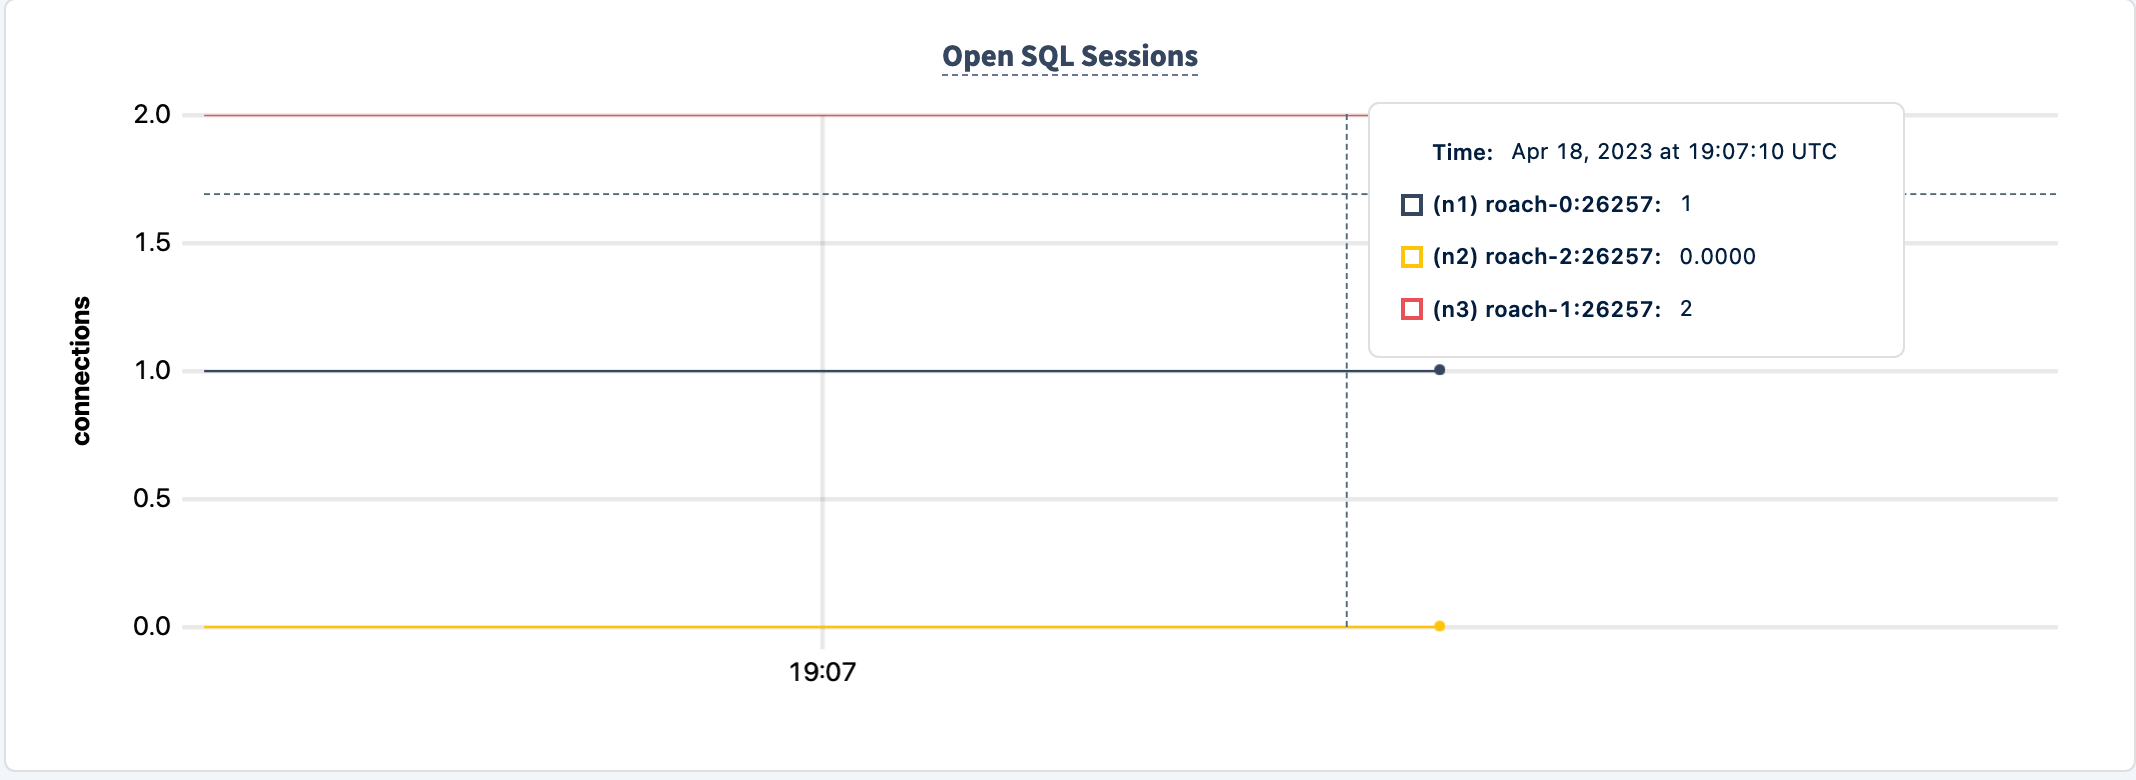
I am going to stop n3 as it's the next node with the least connections
And unfortunately that was enough damage that the client application exits.
progress: 325.0 s, 379.4 tps, lat 18.459 ms stddev 18.185, 0 failed, 0 retried, 0 retries
progress: 330.0 s, 379.4 tps, lat 18.395 ms stddev 20.683, 0 failed, 0 retried, 0 retries
pgbench: error: client 0 script 0 aborted in command 4 query 0: FATAL:  error receiving data from server: SocketError("Error reading message code from socket - Error Kind(UnexpectedEof)")
server closed the connection unexpectedly
        This probably means the server terminated abnormally
        before or while processing the request.
pgbench: error: client 5 script 0 aborted in command 4 query 0: FATAL:  error receiving data from server: SocketError("Error reading message code from socket - Error Kind(UnexpectedEof)")
server closed the connection unexpectedly
        This probably means the server terminated abnormally
        before or while processing the request.
pgbench: error: client 1 script 0 aborted in command 4 query 0: FATAL:  error receiving data from server: SocketError("Error reading message code from socket - Error Kind(UnexpectedEof)")
server closed the connection unexpectedly
        This probably means the server terminated abnormally
        before or while processing the request.
Even if I bring the node back up, the client does not return to processing the workload.
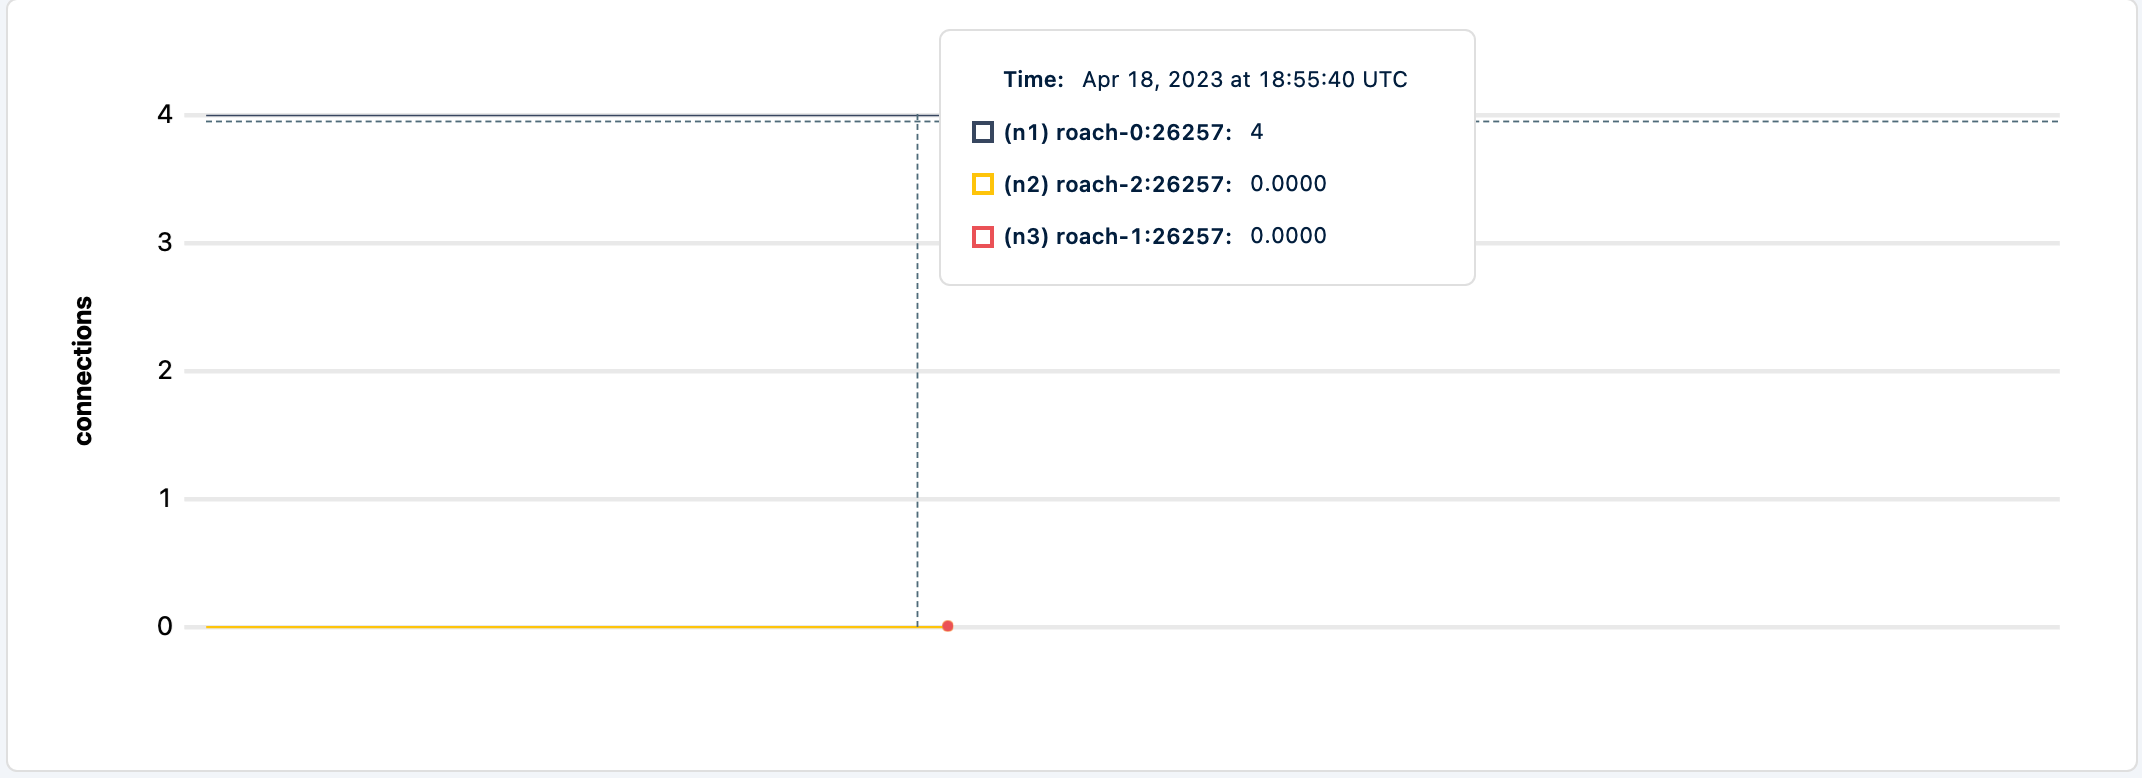
The logs for the pgcat show
[2023-04-18T18:54:38.167965Z WARN pgcat] Client disconnected with error SocketError("Error reading message code from socket - Error Kind(UnexpectedEof)")Unfortunately there's not much else we can do than terminate the client app.
Now let's test the this behavior with another workload built for CockroachDB like tpcc.
cockroach workload fixtures import tpcc --warehouses=10 'postgresql://root@pgcat:6432/tpcc?sslmode=disable'cockroach workload run tpcc --duration=120m --concurrency=3 --max-rate=1000 --tolerate-errors --warehouses=10 --conns 60 --ramp=1m --workers=100 'postgresql://root@pgcat:6432/tpcc?sslmode=disable'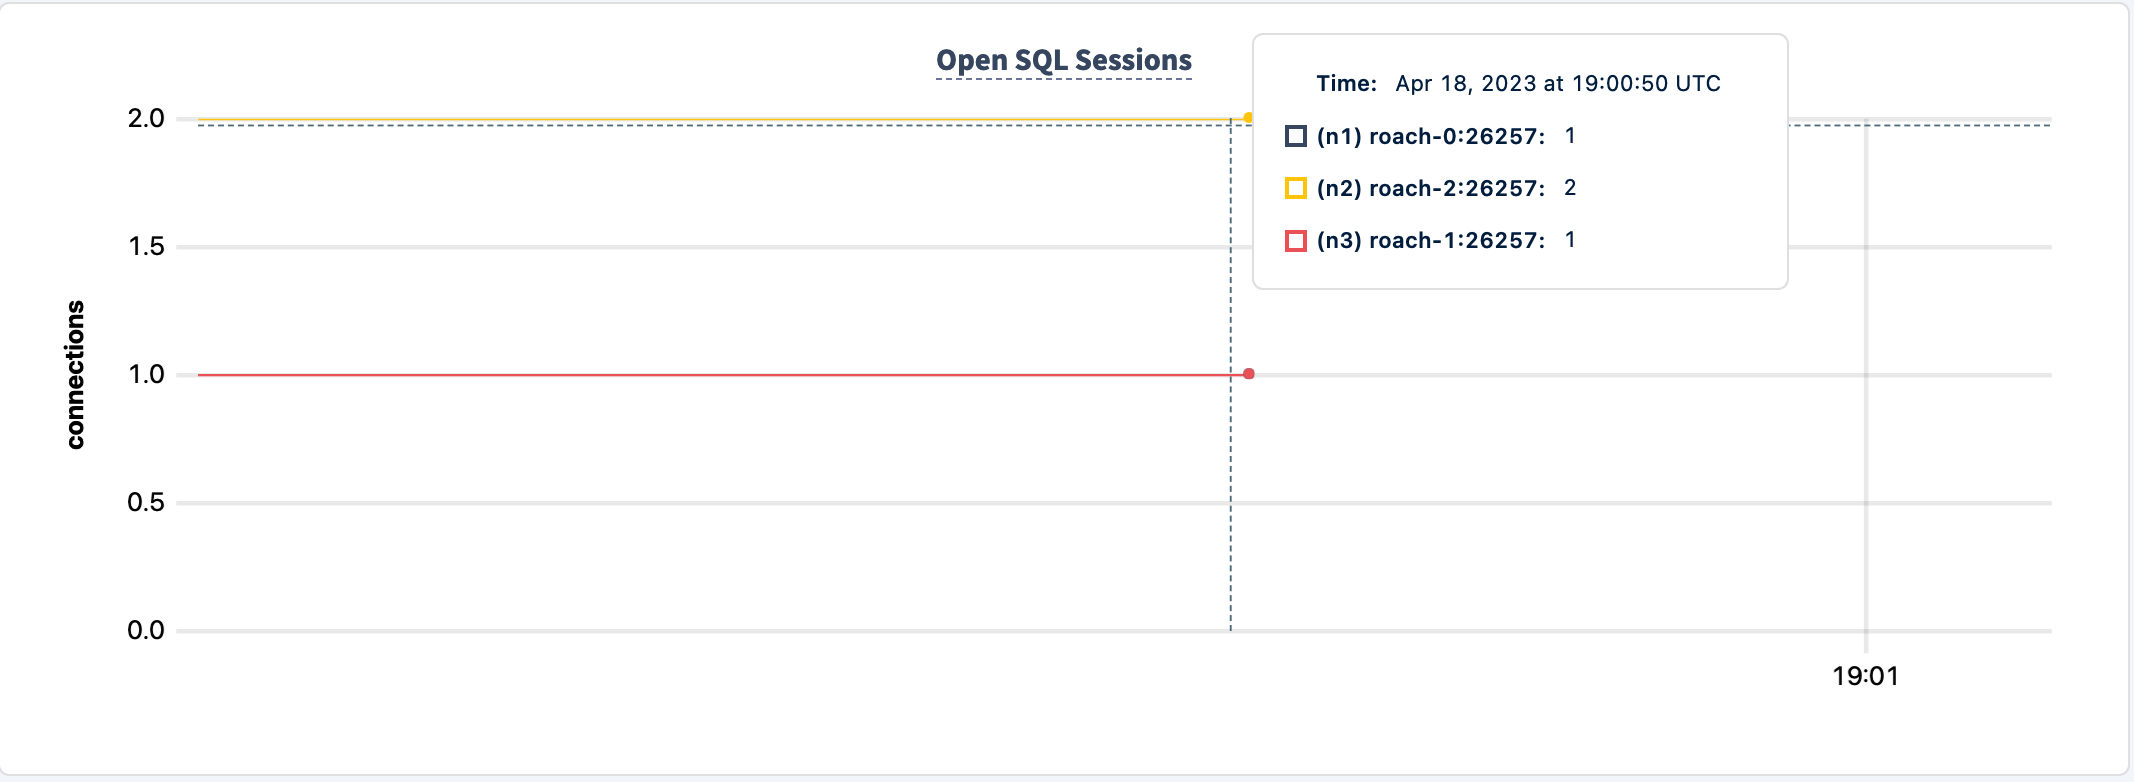
If I shutdown any node, say n1
0.0 orderStatus
   82.0s        0            2.0            2.1     22.0     26.2     26.2     26.2 payment
   82.0s        0            0.0            0.2      0.0      0.0      0.0      0.0 stockLevel
I230418 19:02:06.905997 486 workload/pgx_helpers.go:79  [-] 4  pgx logger [error]: Exec logParams=map[args:[] err:FATAL: error receiving data from server: SocketError("Error reading message code from socket - Error Kind(UnexpectedEof)") (SQLSTATE 58000) pid:3949282881 sql:begin time:509.125µs]
E230418 19:02:06.906775 1 workload/cli/run.go:548  [-] 5  error in newOrder: FATAL: error receiving data from server: SocketError("Error reading message code from socket - Error Kind(UnexpectedEof)") (SQLSTATE 58000)
   83.0s        1            1.0            0.2     50.3     50.3     50.3     50.3 delivery
   83.0s        1            3.0            2.2     22.0     25.2     25.2     25.2 newOrder
the app continues to work
Let's bring it back up and shut down another node
5.7 payment
  217.0s        1            0.0            0.2      0.0      0.0      0.0      0.0 stockLevel
I230418 19:04:22.435535 470 workload/pgx_helpers.go:79  [-] 6  pgx logger [error]: Exec logParams=map[args:[] err:FATAL: error receiving data from server: SocketError("Error reading message code from socket - Error Kind(UnexpectedEof)") (SQLSTATE 58000) pid:1776716436 sql:begin time:2.795459ms]
E230418 19:04:22.436369 1 workload/cli/run.go:548  [-] 7  error in orderStatus: FATAL: error receiving data from server: SocketError("Error reading message code from socket - Error Kind(UnexpectedEof)") (SQLSTATE 58000)
  218.0s        2            0.0            0.2      0.0      0.0      0.0      0.0 delivery
  218.0s        2
You can see that the workload is still running even when another node terminated. This is consistent with what I've been observing. This workload is more resilient to node failures than pgbench.
For the sake of completeness, let's stop n3, aka roach-1.
  547.0s        3            0.0            0.2      0.0      0.0      0.0      0.0 orderStatus
  547.0s        3            3.0            2.1     32.5     37.7     37.7     37.7 payment
  547.0s        3            0.0            0.2      0.0      0.0      0.0      0.0 stockLevel
I230418 19:09:52.400491 467 workload/pgx_helpers.go:79  [-] 10  pgx logger [error]: Exec logParams=map[args:[] err:FATAL: error receiving data from server: SocketError("Error reading message code from socket - Error Kind(UnexpectedEof)") (SQLSTATE 58000) pid:2166109812 sql:begin time:5.855833ms]
E230418 19:09:52.402451 1 workload/cli/run.go:548  [-] 11  error in newOrder: FATAL: error receiving data from server: SocketError("Error reading message code from socket - Error Kind(UnexpectedEof)") (SQLSTATE 58000)
  548.0s        4            0.0            0.2      0.0      0.0      0.0      0.0 delivery
  548.0s        4            1.0            2.1     54.5     54.5     54.5     54.5 newOrder
  548.0s        4            0.0            0.2      0.0      0.0      0.0      0.0 orderStatus
  548.0s        4            2.0            2.1     22.0     29.4     29.4     29.4 payment
  548.0s        4            0.0            0.2      0.0      0.0      0.0      0.0 stockLevel
_elapsed___errors__ops/sec(inst)___ops/sec(cum)__p50(ms)__p95(ms)__p99(ms)_pMax(ms)
  549.0s        4            0.0            0.2      0.0      0.0      0.0      0.0 delivery
  549.0s        4            4.0            2.1     19.9     25.2     25.2     25.2 newOrder
  549.0s        4            0.0            0.2      0.0      0.0      0.0      0.0 orderStatus
  549.0s        4            1.0            2.1     11.5     11.5     11.5     11.5 payment
  549.0s        4            0.0            0.2      0.
This shows applications purpose-built for CockroachDB can withstand failure even when things go awry. I still like pgbench because its so ubuiquitos but I do have to be careful presenting it in resiliency demos.
I've written about pgpass on many occasions 1, 2, 3, 4, this time I'd like to quickly cover PGSERVICEFILE, which is a standard connection service file for Postgresql connection parameters. I've recently come across the following issue, naturally I couldn't pass up an opportunity to look at how it works. Feel free to look at various setups but for my purposes I'm going to configure it the way it is described in the issue.
Edit the ~/.pg_service.conf file with the connection parameters of your CockroachDB cluster.
# CockroachDB Serverless
[serverless]
host=artem-serverless-cluster.cockroachlabs.cloud
port=26257
user=artem
application_name=pgservicefile
You can include any sort of connection parameters here, including password but make sure it's not world readable. Then connect to your cluster
psql service=serverlesspsql (15.2 (Homebrew), server 13.0.0)
SSL connection (protocol: TLSv1.3, cipher: TLS_AES_128_GCM_SHA256, compression: off)
Type "help" for help.
artem=>We can make also confirm the parameters are read from the config file
artem=> show application_name;
 application_name
------------------
 pgservicefile
Unfortunately I do not know the full scope of the service file support with the CockroachDB client. I am finding mixed results. In any case, I've filed the following issue.
cockroach sql --url "postgresql://[email protected]?sslmode=verify-full&service=serverless"For example, the application_name is not being honored. The host cannot be omitted from the connection string but the port and password can be read from the file. This unfortunately decreases the usability of the file unless you use the psql client.
  application_name
--------------------
  $ cockroach sql