Keywords: wind power, Germany, python, ERA5, globalwindatlas
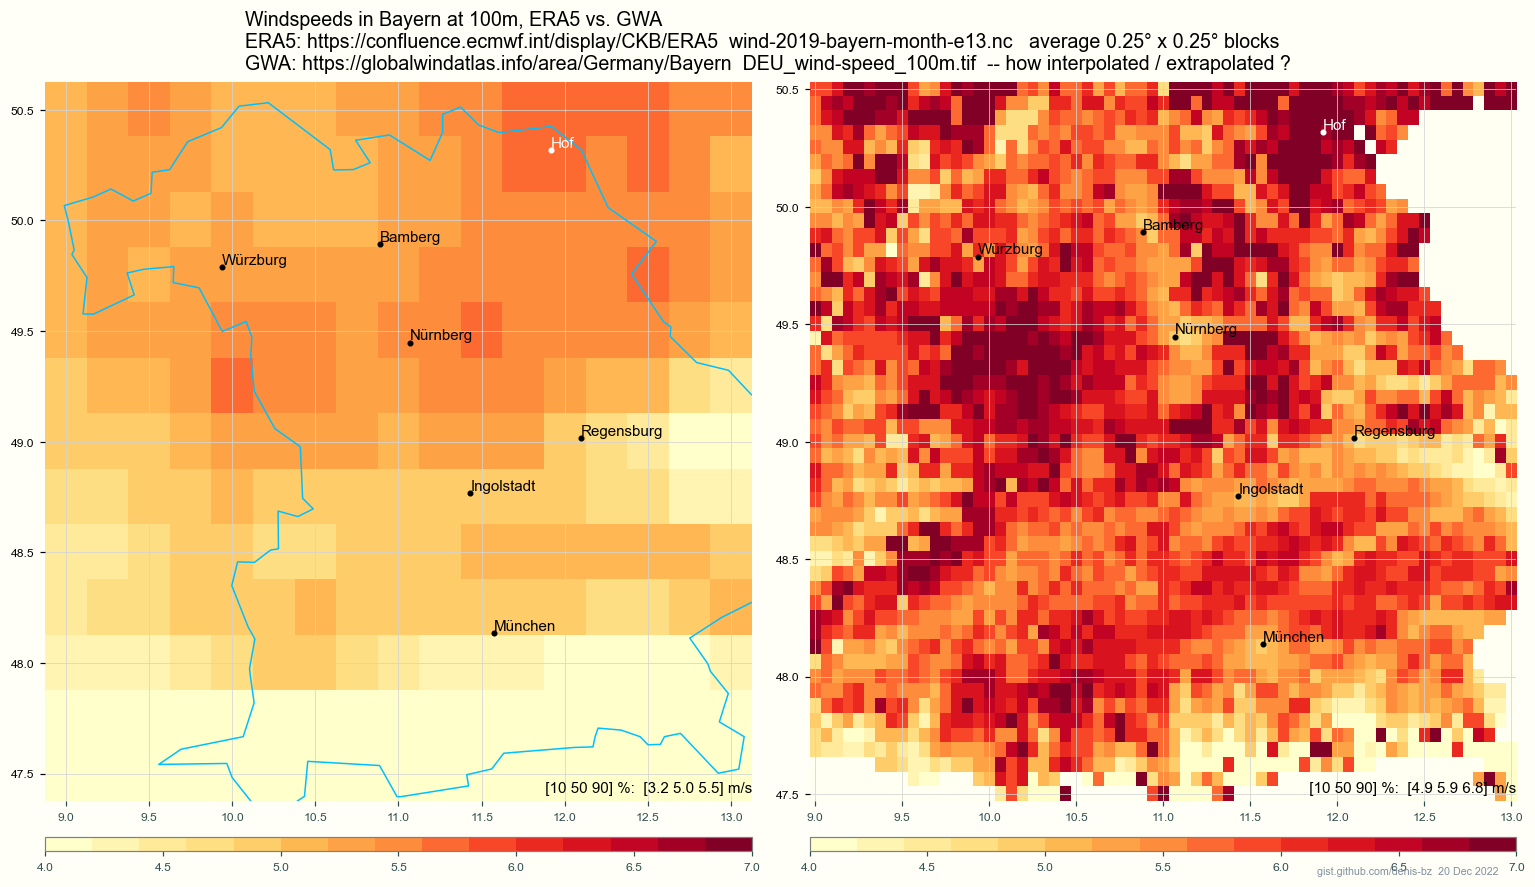
Purpose: look at windspeed estimates at 100m in Bayern from two different sources:
ERA5: https://confluence.ecmwf.int/display/CKB/ERA5
GWA: https://globalwindatlas.info/area/Germany/Bayern
even though these are not directly comparable:
ERA5 has average windspeeds on 0.25° x 0.25° regions (~ 30 x 20 km), whereas
GWA has data on a fine grid, 0.0025° x 0.0025° (here plotted coarser).
How does ERA5 take averages, how does GWA interpolate / extrapolate ? As an old engineer, I like to have a rough idea of where data comes from -- what's measured, what's extrapolated -- and I like spot checks. For GWA, I see neither. Can you help ?
Why are globalwindatlas windspeeds so much higher than ERA5 ?
Their capacity factors are correspondingly high:
31 % DEU_capacity-factor_IEC3.tif (at 100m ?) in Bayern, vs.
22 % from gist Sun-wind-biomass-electricity-Germany.
GWA caps vs real caps at the sites of several windfarms in the Netherlands:
gwacap realcap  MW  GWh              Name  ix  iy    lat    lon knmi50 knmi100 knmi150 gwa50 gwa100 gwa150
    59      37 429 1400   Noordoostpolder 115 108 52.702 5.6148   6.89    7.71    8.26  7.89   8.95   9.91
    63      45 383 1500           Fryslân 105 121  53.01   5.28   8.37    8.98     9.4  8.65   9.48  10.04
    ...
in gist windspeeds-Netherlands-wikipedia-KNMI-GWA
gist Windspeeds and windfarms in Bayern
https://confluence.ecmwf.int/display/CKB/ERA5:+data+documentation
https://confluence.ecmwf.int/display/CKB/Model+grid+box+and+time+step
some sort of average value over the grid scale. However, models don't represent the grid scale very well either
cheers
— denis-bz-py t-online.de 20 Dec 2022
