- Attach label on axis by relative position
\node[yshift=3mm0] at (rel axis cs:0,1) {\bf A};. Always put this line outsizeaxisenvironment. Otherwise, it will be clipped.
\foreach \x in {1,2,3}
{
     % add your plot.
    \edef\temp{\noexpand\addlegendentry{Ca=\SI{\x}{\nano M}}} \temp
}
Use tabular environment with align=baseline options. Otherwise use a global tikzpicture in
which each node itself contain a tikzpicture. The later has the benefit of creating arbitary layout.
\begin{tikzpicture}[scale=1]
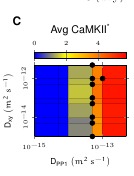
\begin{loglogaxis}[
xlabel=$D_{PP1}$
, ylabel=$D_{xy}$
, view={0}{90}
, width=0.8*\PLOTW cm %, height=\PLOTW cm
, enlargelimits=0.05
, colorbar
, zmin=0
]
\addplot3 [surf, shader=faceted, mesh/rows=7,]
table [col sep=comma,surf
, x expr={10^\thisrow{Dpp1}}
, y expr={10^\thisrow{Dxy}},z=Mean CaMKII
]{./data/CaM:4+PP:100+D:x:5e-14+y:5e-14+PP1:5e-14+N:4.csv};
\addplot3[mesh/rows=7, only marks, shader=faceted
, unbounded coords=jump
% remove zero points
, z filter/.expression={z>0?1:nan}
] table[col sep=comma
, x expr={10^\thisrow{Dpp1}}
, y expr={10^\thisrow{Dxy}},z=is_bistable
]{./data/CaM:4+PP:100+D:x:5e-14+y:5e-14+PP1:5e-14+N:4.csv};
\end{loglogaxis}
\end{tikzpicture}
Genearates the following image (when files are available).

https://tex.stackexchange.com/a/99328/8087
Code from above link.
\documentclass[tikz,preview, border=5mm]{standalone}
\usepackage{tikz,pgfplots,filecontents}
\pgfplotsset{compat=1.7}

%%% Code for "every nth mark" starts here...
\newcounter{marknumber}
\pgfplotsset{
    error bars/every nth mark/.style={
        /pgfplots/error bars/draw error bar/.prefix code={
            \pgfmathtruncatemacro\marknumbercheck{mod(floor(\themarknumber/2),#1)}
            \ifnum\marknumbercheck=0
            \else
                \begin{scope}[opacity=0]
            \fi
        },
        /pgfplots/error bars/draw error bar/.append code={
            \ifnum\marknumbercheck=0
            \else
                \end{scope}
            \fi
            \stepcounter{marknumber}
        }
    }
}
%%% ... and ends here

\begin{filecontents*}{data.dat}
X Y Y_error
1 1.39 0.5
2 2.44 0.5
3 3.62 0.5
4 4.81 0.5
5 1.39 0.5
6 2.44 0.5
7 3.62 0.5
8 4.81 0.5
\end{filecontents*}

\begin{document}

\begin{tikzpicture}
\begin{axis}[
    clip mode=individual,
    ]
    \addplot+[
            error bars/.cd,
                y dir=both,
                y explicit,
                every nth mark=2
        ] table[x=X,y=Y,y error=Y_error] {data.dat};
\end{axis}
\end{tikzpicture}

\end{document}
, colorbar horizontal
, colorbar style={ height=1.5mm, samples=3, draw=none
      , xticklabel style={font=\tiny}, at={(0,1.15)}
      , anchor=south west
      , xticklabel pos=upper
      }
\pgfplotsset{
   compat=1.11,
   legend image code/.code={
      \draw[mark repeat=2,mark phase=2]
           plot coordinates {
           (0cm,0cm)
           (0.15cm,0cm)        %% default is (0.3cm,0cm)
           (0.3cm,0cm)         %% default is (0.6cm,0cm)
       };%
    }
}