Pages: 7
URL: https://goperf.dev/02-networking/tcp-http2-grpc/
Contents:
- Comparing TCP, HTTP/2, and gRPC Performance in Go
- Raw TCP with Custom Framing
- Custom Framing Protocol
- Protocol Structure
- Disadvantages
- Performance Insights
- Custom Framing Protocol
- HTTP/2 via net/http
- Server Implementation
- Performance Insights
- gRPC
In distributed systems, the choice of communication protocol shapes how services interact under real-world load. It influences not just raw throughput and latency, but also how well the system scales, how much CPU and memory it consumes, and how predictable its behavior remains under pressure. In this article, we dissect three prominent options—raw TCP with custom framing, HTTP/2 via Go's built-in net/http package, and gRPC—and explore their performance characteristics through detailed benchmarks and practical scenarios.
Raw TCP provides maximum flexibility with virtually no protocol overhead, but that comes at a cost: all message boundaries, framing logic, and error handling must be implemented manually. Since TCP delivers a continuous byte stream with no inherent notion of messages, applications must explicitly define how to separate and interpret those bytes.
A common way to handle message boundaries over TCP is to use length-prefix framing: each message starts with a 4-byte header that tells the receiver how many bytes to read next. The length is encoded in big-endian format, following the standard network byte order, so it behaves consistently across different systems. This setup solves a core issue with TCP—while it guarantees reliable delivery, it doesn’t preserve message boundaries. Without knowing the size upfront, the receiver has no way to tell where one message ends and the next begins.
TCP guarantees reliable, in-order delivery of bytes, but it does not preserve or indicate message boundaries. For example, if a client sends three logical messages:
the server may receive them as a continuous byte stream with arbitrary segmentations, such as:
TCP delivers a continuous stream of bytes with no built-in concept of where one message stops and another starts. This means the receiver can’t rely on read boundaries to infer message boundaries—what arrives might be a partial message, multiple messages concatenated, or an arbitrary slice of both. To make sense of structured data over such a stream, the application needs a framing strategy. Length-prefixing does this by including the size of the message up front, so the receiver knows exactly how many bytes to expect before starting to parse the payload.
While length-prefixing is the most common and efficient framing strategy, there are other options depending on the use case. Other framing strategies exist, each with its own trade-offs in terms of simplicity, robustness, and flexibility. Delimiter-b
[Content truncated]
Examples:
Example 1 (unknown):
[msg1][msg2][msg3]
Example 2 (unknown):
[msg1_part][msg2][msg3_part]
Example 3 (unknown):
| Length (4 bytes) | Payload (Length bytes) |
Example 4 (go):
func writeFrame(conn net.Conn, payload []byte) error {
    frameLen := uint32(len(payload))
    buf := make([]byte, 4+len(payload))
    binary.BigEndian.PutUint32(buf[:4], frameLen)
    copy(buf[4:], payload)
    _, err := conn.Write(buf)
    return err
}

func readFrame(conn net.Conn) ([]byte, error) {
    lenBuf := make([]byte, 4)
    if _, err := io.ReadFull(conn, lenBuf); err != nil {
        return nil, err
    }
    frameLen := binary.BigEndian.Uint32(lenBuf)
    payload := make([]byte, frameLen)
    if _, err := io.ReadFull(conn, payload); err != nil {
        return nil, err
    }

...URL: https://goperf.dev/02-networking/quic-in-go/
Contents:
- QUIC in Go: Building Low-Latency Services with quic-go
- Understanding QUIC
- QUIC vs. TCP: Key Differences
- Is QUIC Based on DTLS?
- Introducing quic-go
- Getting Started with quic-go
- Basic QUIC Server
- Multiplexed Streams
- Performance: QUIC vs. HTTP/2 and TCP
- Connection Migration
QUIC has emerged as a robust protocol, solving many inherent limitations of traditional TCP connections. QUIC combines encryption, multiplexing, and connection migration into a unified protocol, designed to optimize web performance, particularly in real-time and mobile-first applications. In Go, quic-go is the main QUIC implementation and serves as a practical base for building efficient, low-latency network services with built-in encryption and stream multiplexing.
Originally developed at Google and later standardized by the IETF, QUIC rethinks the transport layer to overcome longstanding TCP limitations:
QUIC takes a fundamentally different approach from TCP. While TCP is built directly on IP and requires a connection-oriented handshake before data can flow, QUIC runs over UDP and handles its own connection logic, reducing setup overhead and improving startup latency. This architectural choice allows QUIC to provide multiplexed, independent streams that effectively eliminate the head-of-line blocking issue commonly experienced with TCP, where the delay or loss of one packet stalls subsequent packets.
QUIC integrates TLS 1.3 directly into its transport layer, eliminating the layered negotiation seen in TCP+TLS. This design streamlines the handshake process and enables 0-RTT data, where repeat connections can begin transmitting encrypted payloads immediately—something TCP simply doesn’t support.
Another key distinction is how connections are identified. TCP connections are bound to a specific IP and port, so any change in network interface results in a broken connection. QUIC avoids this by using connection IDs that remain stable across address changes, allowing sessions to continue uninterrupted when a device moves between networks—critical for mobile and latency-sensitive use cases.
Although QUIC and DTLS both use TLS cryptographic primitives over UDP, QUIC does not build on DTLS. Instead, QUIC incorporates TLS 1.3 directly into its transport layer, inheriting only the cryptographic handshake—not the record framing or protocol structure of DTLS.
QUIC defines its own packet encoding, multiplexing, retransmission, and encryption formats. It wraps TLS handshake messages within QUIC packets and tightly couples encryption state with transport features like packet numbers and stream IDs. In contrast, DTLS operates as a secured datagram layer atop UDP, providing encryption and authentication but leaving transport semantics—such as retransmit, ordering, or
[Content truncated]
Examples:
Example 1 (unknown):
go get github.com/quic-go/quic-go
Example 2 (unknown):
listener, err := quic.ListenAddr("localhost:4242", generateTLSConfig(), nil)
    if err != nil {
        log.Fatal(err)
    }
    fmt.Println("QUIC server listening on localhost:4242")

    for {
        conn, err := listener.Accept(context.Background())
        if err != nil {
            log.Println("Accept error:", err)
            continue
        }
        go handleConn(conn)
    }
Example 3 (unknown):
defer conn.CloseWithError(0, "bye")

    for {
        stream, err := conn.AcceptStream(context.Background())
        if err != nil {
            return
        }

        go func(s quic.Stream) {
            defer s.Close()

            data, err := io.ReadAll(s)
            if len(data) > 0 {
                log.Printf("Received: %s", string(data))
            }
            if err != nil && err != io.EOF {
                if appErr, ok := err.(*quic.ApplicationError); !ok || appErr.ErrorCode != 0 {
                    log.Println("read error:", err)
                }
            }
        }(
...
Example 4 (unknown):
stream, err := session.OpenStreamSync(context.Background())
if err != nil {
    log.Fatal(err)
}
_, err = stream.Write([]byte("Hello QUIC!"))
URL: https://goperf.dev/02-networking/bench-and-load/
Contents:
- Benchmarking and Load Testing for Networked Go Apps
- Test App: Simulating Fast/Slow Paths and GC pressure
- Simulating Load: Tools That Reflect Reality
- When to Use What
- Vegeta
- wrk
- k6
- Profiling Networked Go Applications with pprof
- CPU Profiling
- What to Look For
- CPU Profiling
Before you reach for a mutex-free queue or tune your goroutine pool, step back. Optimization without a baseline is just guesswork. In Go applications, performance tuning starts with understanding how your system behaves under pressure, which means benchmarking it under load.
Load testing isn't just about pushing requests until things break. It's about simulating realistic usage patterns to extract measurable, repeatable data. That data anchors every optimization that follows.
To benchmark meaningfully, we need endpoints that reflect different workload characteristics.
This is by no means an exhaustive list. The ecosystem of load-testing tools is broad and constantly evolving. Tools like Apache JMeter, Locust, Artillery, and Gatling each bring their own strengths—ranging from UI-driven test design to distributed execution or JVM-based scenarios. The right choice depends on your stack, test goals, and team workflow. The tools listed here are optimized for Go-based services and local-first benchmarking, but they’re just a starting point.
At a glance, vegeta, wrk, and k6 all hammer HTTP endpoints. But they serve different roles depending on what you're testing, how much precision you need, and how complex your scenario is.
Each of these tools has a place in your benchmarking toolkit. Picking the right one depends on whether you're validating performance, exploring scaling thresholds, or simulating end-user behavior.
Vegeta is a flexible HTTP load testing tool written in Go, built for generating constant request rates. This makes it well-suited for simulating steady, sustained traffic patterns instead of sudden spikes.
We reach for Vegeta when precision matters. It maintains exact request rates and captures detailed latency distributions, which helps track how system behavior changes under load. It’s lightweight, easy to automate, and integrates cleanly into CI workflows—making it a reliable option for benchmarking Go services.
Which endpoint(s) we are going to test:
Depending on your goals, there are two recommended approaches for testing both /fast and /slow endpoints in a single run.
Option 1: Round-Robin Between Endpoints
Create a targets.txt with both endpoints:
Option 2: Weighted Mix Using Multiple Vegeta Runs
To simulate different traffic proportions (e.g., 80% fast, 20% slow):
Then merge the results and generate a report:
Both methods are valid—choose based on whether you need simplicity or control.
wrk is a high-performance HTTP benchma
[Content truncated]
Examples:
Example 1 (go):
package main

// pprof-start
import (
// pprof-end
    "flag"
    "fmt"
    "log"
    "math/rand/v2"
    "net/http"
// pprof-start
    _ "net/http/pprof"
// pprof-end
    "os"
    "os/signal"
    "time"
// pprof-start
)
// pprof-end

var (
    fastDelay   = flag.Duration("fast-delay", 0, "Fixed delay for fast handler (if any)")
    slowMin     = flag.Duration("slow-min", 1*time.Millisecond, "Minimum delay for slow handler")
    slowMax     = flag.Duration("slow-max", 300*time.Millisecond, "Maximum delay for slow handler")
    gcMinAlloc  = flag.Int("gc-min-alloc", 50, "Minimum number of alloca
...
Example 2 (unknown):
go run main.go
Example 3 (unknown):
go install github.com/tsenart/vegeta@latest
Example 4 (unknown):
echo "GET http://localhost:8080/slow" > targets.txt
URL: https://goperf.dev/02-networking/
Contents:
- Practical Networking Patterns in Go
- Benchmarking First
- Foundations and Core Concepts
- Scaling and Performance Engineering
- Diagnostics and Resilience
- Transport-Level Optimization
- Low-Level and Advanced Tuning
A 13-part guide to building scalable, efficient, and resilient networked applications in Go—grounded in real-world benchmarks, low-level optimizations, and practical design patterns.
Benchmarking and Load Testing for Networked Go Apps
Establish performance baselines before optimizing anything. Learn how to simulate realistic traffic using tools like vegeta, wrk, and k6. Covers throughput, latency percentiles, connection concurrency, and profiling under load. Sets the foundation for diagnosing bottlenecks and measuring the impact of every optimization in the series.
How Go Handles Networking: Concurrency, Goroutines, and the net Package
Understand Go’s approach to networking from the ground up. Covers how goroutines, the net package, and the runtime scheduler interact, including blocking I/O behavior, connection handling, and the use of pollers like epoll or kqueue under the hood.
Efficient Use of net/http, net.Conn, and UDP
Compare idiomatic and advanced usage of net/http vs raw net.Conn. Dive into connection pooling, custom dialers, stream reuse, and buffer tuning. Demonstrates how to avoid common pitfalls like leaking connections, blocking handlers, or over-allocating buffers.
Managing 10K++ Concurrent Connections in Go
Handling massive concurrency requires intentional architecture. Explore how to efficiently serve 10,000+ concurrent sockets using Go’s goroutines, proper resource capping, socket tuning, and runtime configuration. Focuses on connection lifecycles, scaling pitfalls, and real-world tuning.
GOMAXPROCS, epoll/kqueue, and Scheduler-Level Tuning
Dive into low-level performance knobs like GOMAXPROCS, GODEBUG, thread pinning, and how Go’s scheduler interacts with epoll/kqueue. Learn when increasing parallelism helps—and when it doesn’t. Includes tools for CPU affinity and benchmarking the effect of these changes.
Building Resilient Connection Handling with Load Shedding and Backpressure
Learn how to prevent overloads from crashing your system. Covers circuit breakers, passive vs active load shedding, backpressure strategies using channel buffering and timeouts, and how to reject or degrade requests gracefully under pressure.
Memory Management and Leak Prevention in Long-Lived Connections
Long-lived connections like WebSockets or TCP streams can slowly leak memory or accumulate goroutines. This post shows how to identify common leaks, enforce read/write deadlines, manage backpressure, and trace heap growth with memory profiles.
Comp
[Content truncated]
URL: https://goperf.dev/02-networking/low-level-optimizations/
Contents:
- Low-Level Network Optimizations: Socket Options That Matter
- Disabling Nagle’s Algorithm: TCP_NODELAY
- SO_REUSEPORT for Scalability
- Tuning Socket Buffer Sizes: SO_RCVBUF and SO_SNDBUF
- TCP Keepalives for Reliability
- Connection Backlog: SOMAXCONN
- Safely Wrapping Syscalls in Go
- Real-World Considerations
Socket settings can limit both throughput and latency when the system is under load. The defaults are designed for safety and compatibility, not for any particular workload. In practice they often become the bottleneck before CPU or memory do. Go lets you reach the underlying file descriptors through syscall, so you can change key socket options without giving up its concurrency model or the standard library.
Nagle’s algorithm exists to make TCP more efficient. Every tiny packet you send carries headers that add up to a lot of wasted bandwidth if left unchecked. Nagle fixes that by holding back small writes until it can batch them into a full segment, cutting down on overhead and network chatter. That trade-off — bandwidth at the expense of latency — is usually fine, which is why it’s on by default. But if your application sends lots of small, time-critical messages, like a game server or a trading system, waiting even a few milliseconds for the buffer to fill can hurt.
Nagle’s algorithm trades latency for efficiency by holding back small packets until there’s more data to send or an acknowledgment comes back. That delay is fine for bulk transfers but a problem for anything that needs fast, small messages. Setting TCP_NODELAY turns it off so data goes out immediately. This is critical for workloads like gaming, trading, real-time video, and other interactive systems where you can’t afford to wait.
In Go, you can turn off Nagle’s algorithm with TCP_NODELAY:
SO_REUSEPORT lets multiple sockets on the same machine bind to the same port and accept connections at the same time. Instead of funneling all incoming connections through one socket, the kernel distributes new connections across all of them, so each socket gets its own share of the load. This is useful when running several worker processes or threads that each accept connections independently, because it removes the need for user-space coordination and avoids contention on a single accept queue. It also makes better use of multiple CPU cores by letting each process or thread handle its own queue of connections directly.
Typical scenarios for SO_REUSEPORT:
In Go, SO_REUSEPORT isn’t exposed in the standard library, but it can be set via syscall when creating the socket. This is done with syscall.SetsockoptInt, which operates on the socket’s file descriptor. You pass the protocol level (SOL_SOCKET), the option (SO_REUSEPORT), and the value (1 to enable). This must happen before calling bind(), so it’
[Content truncated]
Examples:
Example 1 (unknown):
sequenceDiagram
    participant App as Application
    participant TCP as TCP Stack
    participant Net as Network

    App->>TCP: Send 1 byte
    note right of TCP: Buffering (no ACK received)
    App->>TCP: Send 1 byte
    note right of TCP: Still buffering...

    TCP-->>Net: Send 2 bytes (batched)
    Net-->>TCP: ACK received

    App->>TCP: Send 1 byte
    TCP-->>Net: Immediately send (ACK received, buffer clear)
Example 2 (unknown):
func SetTCPNoDelay(conn *net.TCPConn) error {
    return conn.SetNoDelay(true)
}
Example 3 (unknown):
listenerConfig := &net.ListenConfig{
    Control: func(network, address string, c syscall.RawConn) error {
        return c.Control(func(fd uintptr) {
            syscall.SetsockoptInt(int(fd), syscall.SOL_SOCKET, syscall.SO_REUSEPORT, 1)
        })
    },
}
listener, err := listenerConfig.Listen(context.Background(), "tcp", ":8080")
Example 4 (go):
func SetSocketBuffers(conn *net.TCPConn, recvBuf, sendBuf int) error {
    if err := conn.SetReadBuffer(recvBuf); err != nil {
        return err
    }
    return conn.SetWriteBuffer(sendBuf)
}URL: https://goperf.dev/02-networking/resilient-connection-handling/
Contents:
- Building Resilient Connection Handling with Load Shedding and Backpressure
- Circuit Breakers: Failure Isolation
- What It Does
- Why It Matters
- Implementation Sketch
- Load Shedding: Passive vs Active
- Passive Load Shedding
- Why It Matters
- Active Load Shedding
- Why It Matters
- Passive Load Shedding
In high-throughput services, connection floods and sudden spikes can saturate resources, leading to latency spikes or complete system collapse. This article dives into the low-level mechanisms—circuit breakers, load shedding (passive and active), backpressure via channel buffering and timeouts—and shows how to degrade or reject requests gracefully when pressure mounts.
Circuit breakers guard downstream dependencies by short‑circuiting calls when error rates or latencies exceed thresholds. Without them, a slow or failing service causes client goroutines to pile up, consuming all threads or connections and triggering cascading failure. This mechanism isolates failing services, preventing them from affecting the overall system stability. A circuit breaker continuously monitors response times and error rates, intelligently managing request flow and allowing the system to adapt to changing conditions automatically.
A circuit breaker maintains three states:
Without circuit breakers, services depending on slow or failing components will eventually experience thread exhaustion, request queue buildup, and degraded tail latencies. Circuit breakers introduce bounded failure response by proactively rejecting requests once a dependency is known to be unstable. This reduces the impact surface of a single failure and increases system recoverability. During the Half-Open phase, only limited traffic probes the system, minimizing the risk of amplifying an unstable recovery. Circuit breakers are especially critical in distributed systems where fault domains span across network and service boundaries. They also serve as a feedback mechanism, signaling operational anomalies without requiring centralized alerting.
There are many ways to implement a Circuit Breaker, each varying in complexity and precision. Some designs use fixed time windows, others rely on exponential backoff, or combine error rates with latency thresholds. In this article, we’ll focus on a simple, practical approach: a sliding window with discrete time buckets for failure tracking, combined with a straightforward three-state machine to control call flow and recovery.
First, we need a lightweight way to track how many failures have occurred recently. Instead of maintaining an unbounded history, we use a sliding window with fixed-size time buckets:
Each bucket counts events for a short time slice. As time moves forward, we rotate to the next bucket and reset it, ensuring old data naturally fades away. Her
[Content truncated]
Examples:
Example 1 (unknown):
stateDiagram-v2
    [*] --> Closed
    Closed --> Open : errorRate > threshold
    Open --> HalfOpen : resetTimeout expires
    HalfOpen --> Closed : testSuccess >= threshold
    HalfOpen --> Open : testFailure
Example 2 (unknown):
flowchart TD
subgraph SlidingWindow ["Sliding Window (last N intervals)"]
    B0((Bucket 0))
    B1((Bucket 1))
    B2((Bucket 2))
    B3((Bucket 3))
    B4((Bucket 4))
end

B0 -.-> Tick1["Tick(): move idx + reset bucket"]
Tick1 --> B1
B1 -.-> Tick2["Tick()"]
Tick2 --> B2
B2 -.-> Tick3["Tick()"]
Tick3 --> B3
B3 -.-> Tick4["Tick()"]
Tick4 --> B4
B4 -.-> Tick5["Tick()"]
Tick5 --> B0

B0 -.-> SumFailures["Sum all failures"]

SumFailures -->|Failures >= errorThreshold| OpenCircuit["Circuit Opens"]

OpenCircuit --> WaitReset["Wait resetTimeout"]
WaitReset --> HalfOpen["Move to Half-Open state"]

su
...
Example 3 (unknown):
type slidingWindow struct {
    buckets []int32
    size    int
    idx     int
    mu      sync.Mutex
}
Example 4 (unknown):
func (w *slidingWindow) Tick() {
    w.mu.Lock()
    defer w.mu.Unlock()
    w.idx = (w.idx + 1) % w.size
    atomic.StoreInt32(&w.buckets[w.idx], 0)
}
URL: https://goperf.dev/02-networking/gc-endpoint-profiling/
Contents:
- Practical Example: Profiling Networked Go Applications with pprof
- CPU Profiling in Networked Apps
- CPU Profiling Walkthrough: Load on the /gc Endpoint
- Where the Time Went
- HTTP Stack Dominates the Surface
- Garbage Collection Overhead is Clearly Visible
- I/O and Syscalls Take a Big Slice
- Scheduler Activity Is Non-Trivial
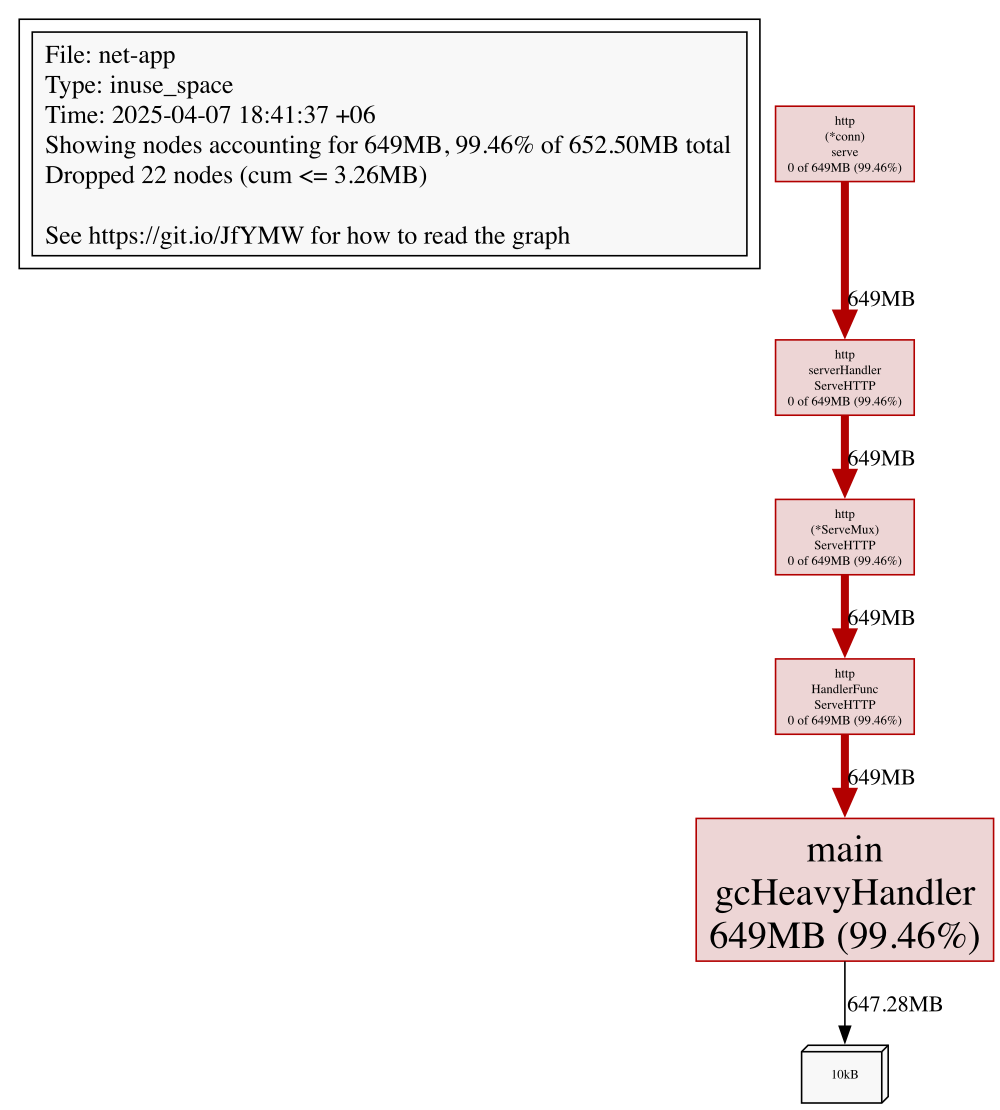
- Memory Profiling: Retained Heap from the /gc Endpoint
- Summary: CPU and Memory Profiling of the /gc Endpoint
This section walks through a demo application instrumented with benchmarking tools and runtime profiling to ground profiling concepts in a real-world context. It covers identifying performance bottlenecks, interpreting flame graphs, and analyzing system behavior under various simulated network conditions.
The demo application is intentionally designed to be as simple as possible to highlight key profiling concepts without unnecessary complexity. While the code and patterns used in the demo are basic, the profiling insights gained here are highly applicable to more complex, production-grade applications.
To enable continuous profiling under load, we expose pprof via a dedicated HTTP endpoint:
The next step will be to establish a connection with the profiled app and collect samples:
View results interactively:
or you can save the profiling graph as an svg image.
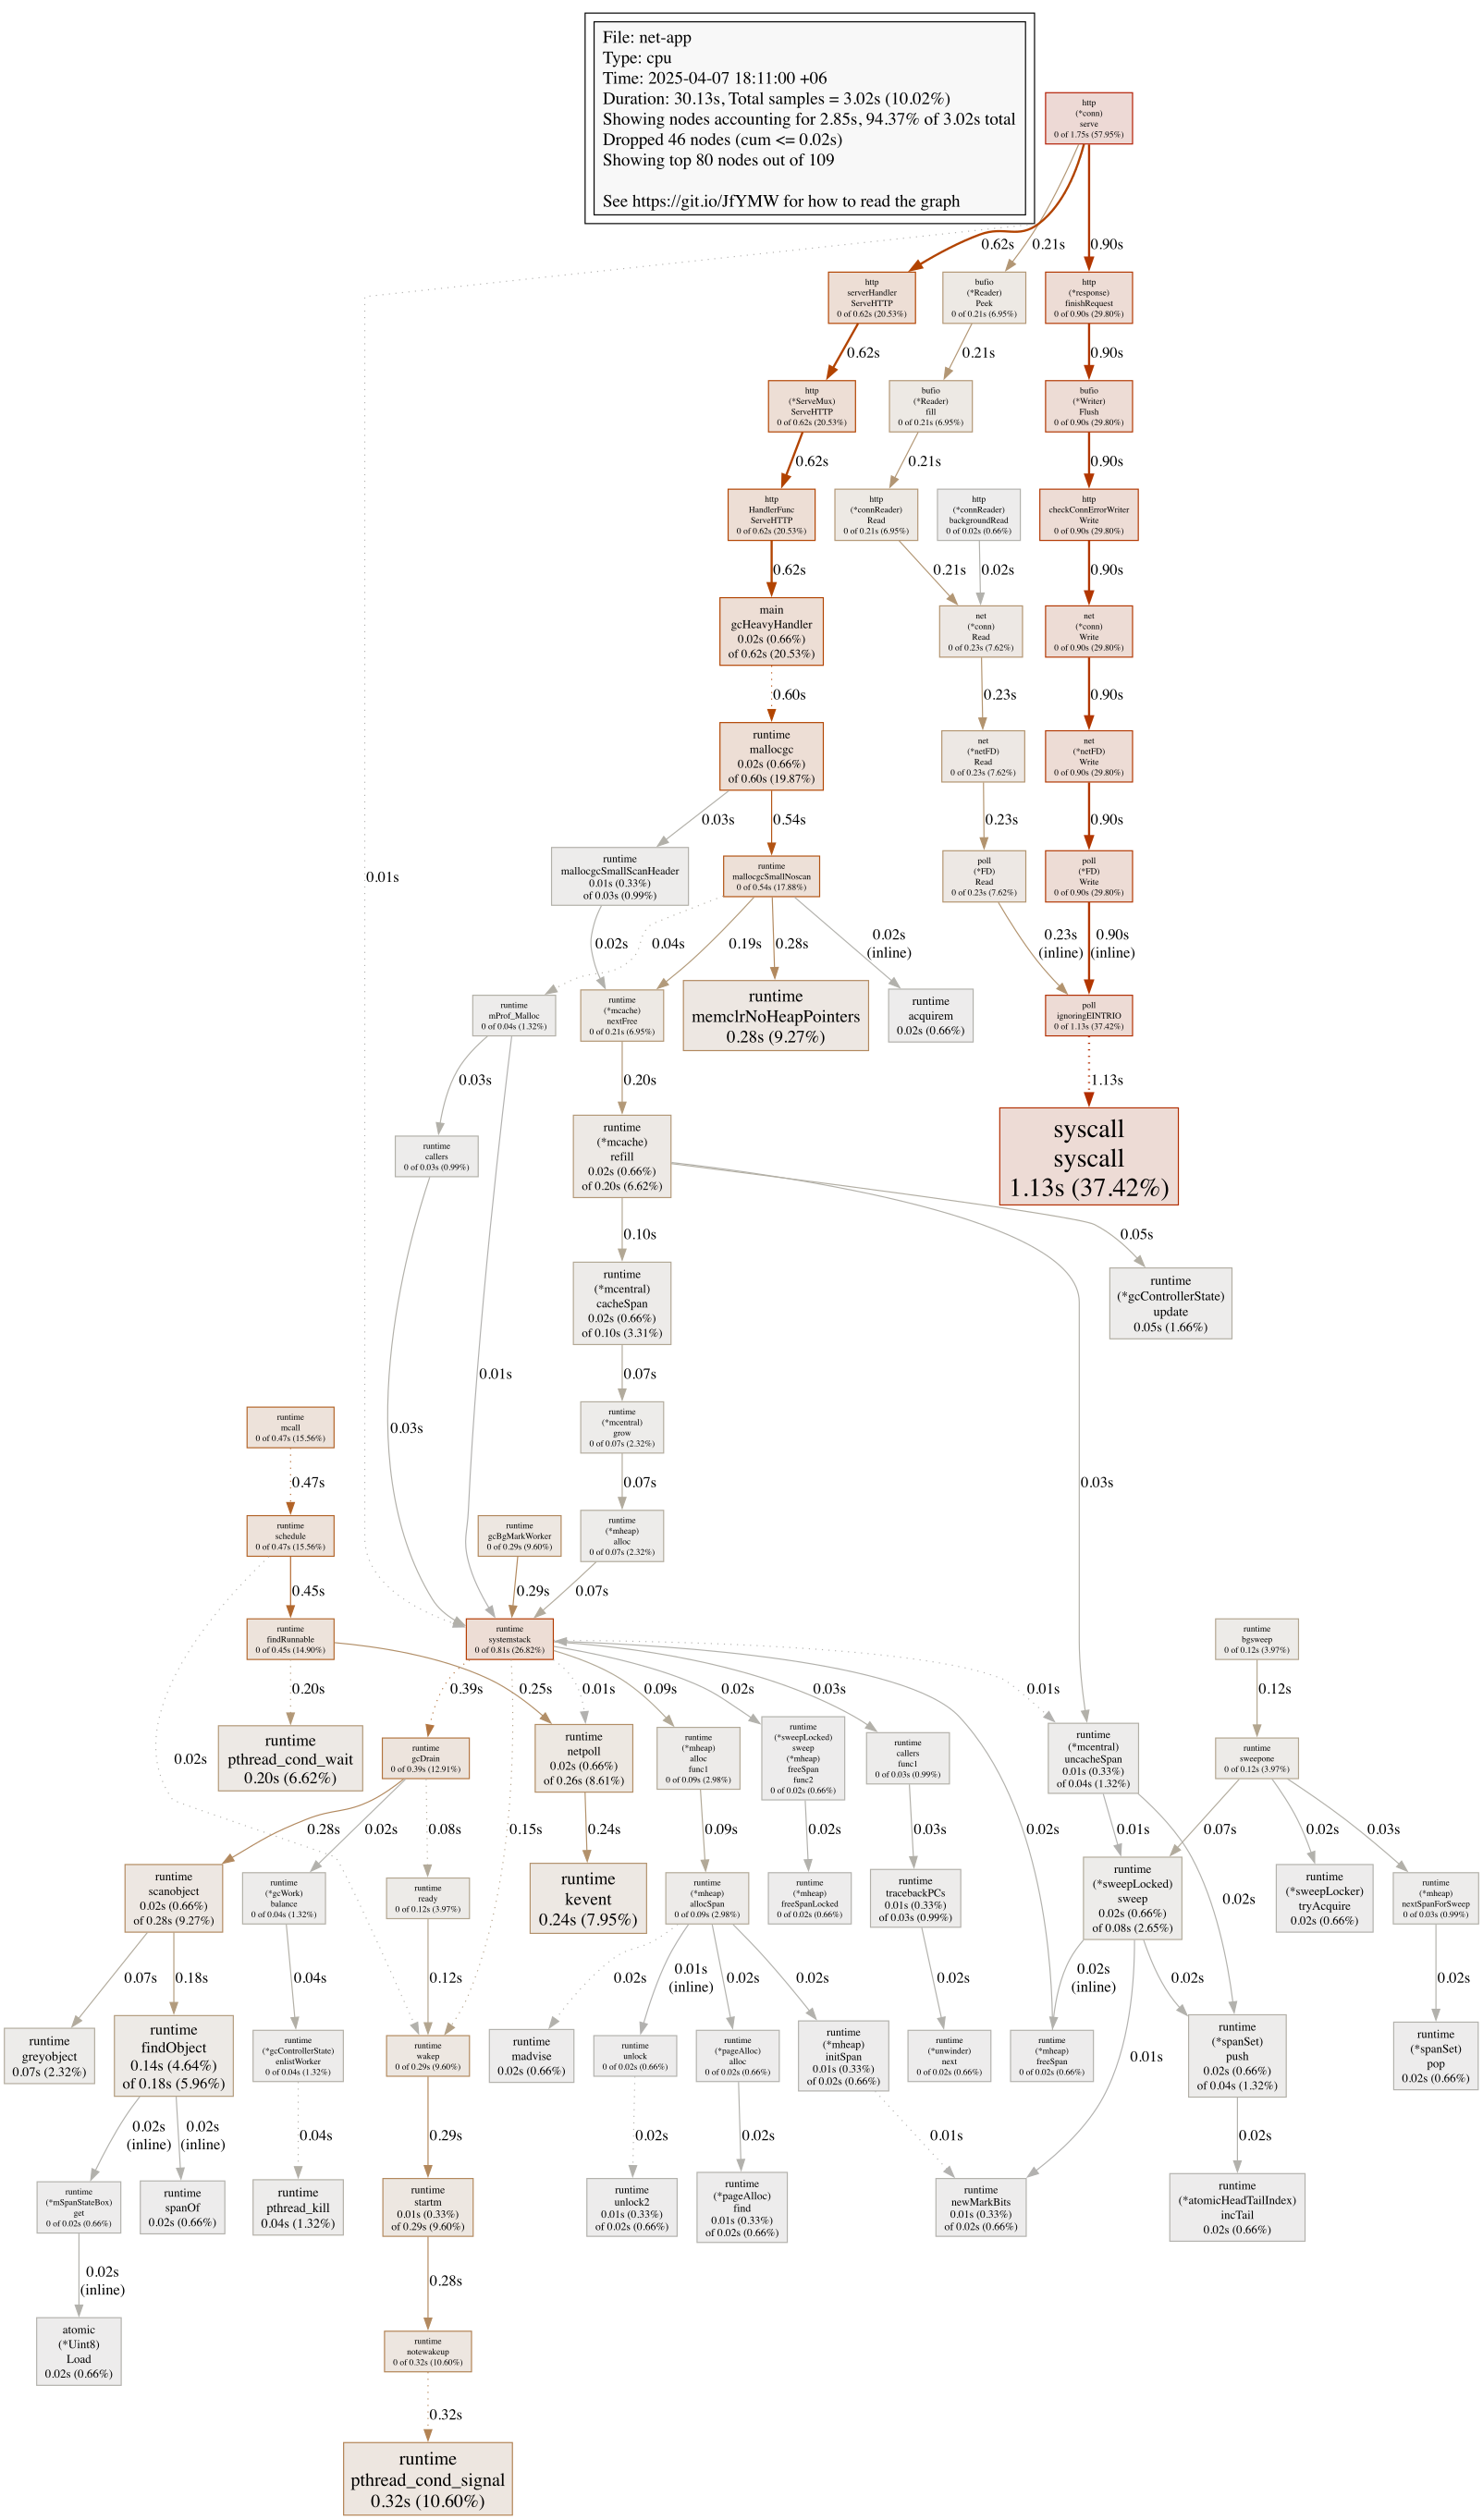
We profiled the application during a 30-second load test targeting the /gc endpoint to see what happens under memory pressure. This handler was intentionally designed to trigger allocations and force garbage collection, which makes it a great candidate for observing runtime behavior under stress.
We used Go’s built-in profiler to capture a CPU trace:
This gave us 3.02 seconds of sampled CPU activity out of 30 seconds of wall-clock time—a useful window into what the runtime and application were doing under pressure.
As expected, the majority of CPU time was spent on request handling:
This aligns with the fact that we were sustaining constant traffic. The Go HTTP stack is doing the bulk of the work, managing connections and dispatching requests.
A large portion of CPU time was spent inside the garbage collector:
This confirms that gcHeavyHandler is achieving its goal. What we care about is whether this kind of allocation pressure leaks into real-world handlers. If it does, we’re paying for it in latency and CPU churn.
We also saw high syscall activity—especially from:
These functions reflect the cost of writing responses back to clients. For simple handlers, this is expected. But if your handler logic is lightweight and most of the time is spent just flushing data over TCP, it’s worth asking whether the payloads or buffer strategies could be optimized.
Functions like runtime.schedule, mcall, and findRunnable were also on the board. These are Go runtime internals responsible for managing goroutines. Seeing them isn’t unusual during high-concurrency tests—but if they dominate, it often poi
[Content truncated]
Examples:
Example 1 (unknown):
import (

    _ "net/http/pprof"

)

// ...

    // Start pprof in a separate goroutine.
    go func() {
        log.Println("pprof listening on :6060")
        if err := http.ListenAndServe("localhost:6060", nil); err != nil {
            log.Fatalf("pprof server error: %v", err)
        }
    }()
Example 2 (go):
package main

// pprof-start
import (
// pprof-end
    "flag"
    "fmt"
    "log"
    "math/rand/v2"
    "net/http"
// pprof-start
    _ "net/http/pprof"
// pprof-end
    "os"
    "os/signal"
    "time"
// pprof-start
)
// pprof-end

var (
    fastDelay   = flag.Duration("fast-delay", 0, "Fixed delay for fast handler (if any)")
    slowMin     = flag.Duration("slow-min", 1*time.Millisecond, "Minimum delay for slow handler")
    slowMax     = flag.Duration("slow-max", 300*time.Millisecond, "Maximum delay for slow handler")
    gcMinAlloc  = flag.Int("gc-min-alloc", 50, "Minimum number of alloca
...
Example 3 (unknown):
go tool pprof http://localhost:6060/debug/pprof/profile?seconds=30
Example 4 (unknown):
go tool pprof -http=:7070 cpu.prof # (1)