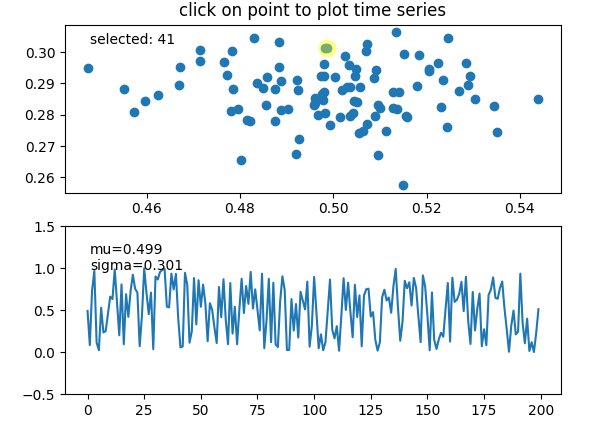
The output:
| # source: https://matplotlib.org/examples/event_handling/data_browser.html | |
| import numpy as np | |
| class PointBrowser(object): | |
| """ | |
| Click on a point to select and highlight it -- the data that | |
| generated the point will be shown in the lower axes. Use the 'n' | |
| and 'p' keys to browse through the next and previous points | |
| """ | |
| def __init__(self): | |
| self.lastind = 0 | |
| self.text = ax.text(0.05, 0.95, 'selected: none', | |
| transform=ax.transAxes, va='top') | |
| self.selected, = ax.plot([xs[0]], [ys[0]], 'o', ms=12, alpha=0.4, | |
| color='yellow', visible=False) | |
| def onpress(self, event): | |
| if self.lastind is None: | |
| return | |
| if event.key not in ('n', 'p'): | |
| return | |
| if event.key == 'n': | |
| inc = 1 | |
| else: | |
| inc = -1 | |
| self.lastind += inc | |
| self.lastind = np.clip(self.lastind, 0, len(xs) - 1) | |
| self.update() | |
| def onpick(self, event): | |
| if event.artist != line: | |
| return True | |
| N = len(event.ind) | |
| if not N: | |
| return True | |
| # the click locations | |
| x = event.mouseevent.xdata | |
| y = event.mouseevent.ydata | |
| # calculating distance using euclidean formula | |
| distances = np.hypot(x - xs[event.ind], y - ys[event.ind]) | |
| indmin = distances.argmin() | |
| dataind = event.ind[indmin] | |
| self.lastind = dataind | |
| self.update() | |
| def update(self): | |
| if self.lastind is None: | |
| return | |
| dataind = self.lastind | |
| ax2.cla() | |
| ax2.plot(X[dataind]) | |
| ax2.text(0.05, 0.9, 'mu=%1.3f\nsigma=%1.3f' % (xs[dataind], ys[dataind]), | |
| transform=ax2.transAxes, va='top') | |
| ax2.set_ylim(-0.5, 1.5) | |
| self.selected.set_visible(True) | |
| self.selected.set_data(xs[dataind], ys[dataind]) | |
| self.text.set_text('selected: %d' % dataind) | |
| fig.canvas.draw() | |
| if __name__ == '__main__': | |
| import matplotlib.pyplot as plt | |
| X = np.random.rand(100, 200) | |
| xs = np.mean(X, axis=1) | |
| ys = np.std(X, axis=1) | |
| fig, (ax, ax2) = plt.subplots(2, 1) | |
| ax.set_title('click on point to plot time series') | |
| line, = ax.plot(xs, ys, 'o', picker=5) # 5 points tolerance | |
| browser = PointBrowser() | |
| fig.canvas.mpl_connect('pick_event', browser.onpick) | |
| fig.canvas.mpl_connect('key_press_event', browser.onpress) | |
| plt.show() |