Created
July 3, 2023 13:12
-
-
Save fancellu/1a548888c204d6dea09465f83dd4e06d to your computer and use it in GitHub Desktop.
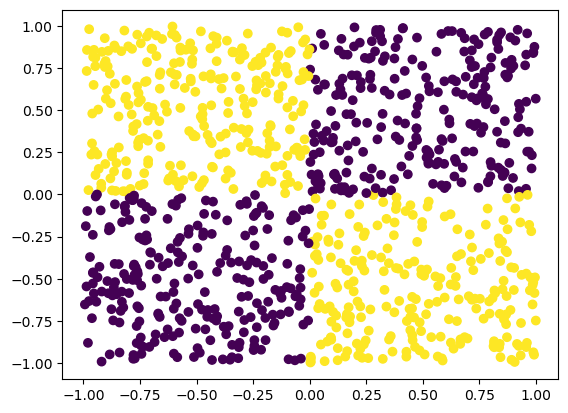
Plotting an XOR function in matplotlib
This file contains hidden or bidirectional Unicode text that may be interpreted or compiled differently than what appears below. To review, open the file in an editor that reveals hidden Unicode characters.
Learn more about bidirectional Unicode characters
| ## Plotting an XOR function | |
| import numpy as np | |
| import matplotlib.pyplot as plt | |
| X=np.random.random((1000,2))*2-1 # between -1 and 1 | |
| Y=[ (x[0]>0) !=(x[1]>0) for x in X] # xor is true if booleans are unequal | |
| plt.scatter(X[:,0], X[:,1],c=Y); |
Author
fancellu
commented
Jul 3, 2023
Sign up for free
to join this conversation on GitHub.
Already have an account?
Sign in to comment