-
-
Save hakimabdi/7308bbd6d9d94cf0a1b8 to your computer and use it in GitHub Desktop.
| ############################################################################################# | |
| # title : Gridded Correlation of Time Series Raster Data (Gridcorts) | |
| # purpose : Pixelwise time series correlation and significance based on Pearson's r, | |
| # : Spearman's rho or Kendall's tau | |
| # author : Abdulhakim Abdi (@HakimAbdi) | |
| # input : Raster brick comprising two time series of equal number of layers | |
| # output : Raster object of pixelwise correlation, significance or both (i.e. brick) | |
| # : based on the chosen method | |
| # update : Minor based suggestion from Tao Xiong of Northeast Normal University in China. | |
| # data : Test data: https://1drv.ms/u/s!AsHsKb_qtbkwgvoQuHnPaFazPr_XnA?e=fJ9fue | |
| ############################################################################################# | |
| # Please cite this paper if you use this code in a publication | |
| ############################################################################################# | |
| # CITATION: Abdi, Abdulhakim M., et al. "The El Niño–La Niña cycle and recent trends in supply | |
| # and demand of net primary productivity in African drylands." Climatic Change 138.1-2 (2016): 111-125. | |
| # https://link.springer.com/article/10.1007/s10584-016-1730-1 | |
| ############################################################################################# | |
| gridcorts <- function(rasterstack, method, type=c("corel","pval","both")){ | |
| # Values for (layers, ncell, ncol, nrow, method, crs, extent) come straight from the input raster stack | |
| # e.g. nlayers(rasterstack), ncell(rasterstack)... etc. | |
| print(paste("Start Gridcorts:",Sys.time())) | |
| print("Loading parameters") | |
| layers=nlayers(rasterstack);ncell=ncell(rasterstack); | |
| ncol=ncol(rasterstack);nrow=nrow(rasterstack);crs=crs(rasterstack); | |
| extent=extent(rasterstack);pb = txtProgressBar(min = 0, max = ncell, initial = 0) | |
| print("Done loading parameters") | |
| mtrx <- as.matrix(rasterstack,ncol=layers) | |
| empt <- matrix(nrow=ncell, ncol=2) | |
| print("Initiating loop operation") | |
| if (type == "corel"){ | |
| for (i in 1:ncell){ | |
| setTxtProgressBar(pb,i) | |
| if (all(is.na(mtrx[i,1:(layers/2)])) | all(is.na(mtrx[i,((layers/2)+1):layers]))){ | |
| empt[i,1] <- NA | |
| } else | |
| if (sum(!is.na(mtrx[i,1:(layers/2)]/mtrx[i,((layers/2)+1):layers])) < 4 ){ | |
| empt[i,1] <- NA | |
| } else | |
| empt[i,1] <- as.numeric(cor.test(mtrx[i,1:(layers/2)], mtrx[i,((layers/2)+1):layers],method=method)$estimate) | |
| } | |
| print("Creating empty raster") | |
| corel <- raster(nrows=nrow,ncols=ncol,crs=crs) | |
| extent(corel) <- extent | |
| print("Populating correlation raster") | |
| values(corel) <- empt[,1] | |
| print(paste("Ending Gridcorts on",Sys.time())) | |
| corel | |
| } | |
| else | |
| if (type == "pval"){ | |
| for (i in 1:ncell){ | |
| setTxtProgressBar(pb,i) | |
| if (all(is.na(mtrx[i,1:(layers/2)])) | all(is.na(mtrx[i,((layers/2)+1):layers]))){ | |
| empt[i,2] <- NA | |
| } else | |
| if (sum(!is.na(mtrx[i,1:(layers/2)]/mtrx[i,((layers/2)+1):layers])) < 4 ){ | |
| empt[i,2] <- NA | |
| } else | |
| empt[i,2] <- as.numeric(cor.test(mtrx[i,1:(layers/2)], mtrx[i,((layers/2)+1):layers],method=method)$p.value) | |
| } | |
| pval <- raster(nrows=nrow,ncols=ncol,crs=crs) | |
| extent(pval) <- extent | |
| print("Populating significance raster") | |
| values(pval) <- empt[,2] | |
| print(paste("Ending Gridcorts on",Sys.time())) | |
| pval | |
| } | |
| else | |
| if (type == "both"){ | |
| for (i in 1:ncell){ | |
| setTxtProgressBar(pb,i) | |
| if (all(is.na(mtrx[i,1:(layers/2)])) | all(is.na(mtrx[i,((layers/2)+1):layers]))){ | |
| empt[i,] <- NA | |
| } else | |
| if (sum(!is.na(mtrx[i,1:(layers/2)]/mtrx[i,((layers/2)+1):layers])) < 4 ){ | |
| empt[i,] <- NA | |
| } else { | |
| empt[i,1] <- as.numeric(cor.test(mtrx[i,1:(layers/2)], mtrx[i,((layers/2)+1):layers],method=method)$estimate) | |
| empt[i,2] <- as.numeric(cor.test(mtrx[i,1:(layers/2)], mtrx[i,((layers/2)+1):layers],method=method)$p.value) | |
| } | |
| } | |
| c <- raster(nrows=nrow,ncols=ncol,crs=crs) | |
| p <- raster(nrows=nrow,ncols=ncol,crs=crs) | |
| print("Populating raster brick") | |
| values(c) <- empt[,1] | |
| values(p) <- empt[,2] | |
| brk <- brick(c,p) | |
| extent(brk) <- extent | |
| names(brk) <- c("Correlation","Pvalue") | |
| print(paste("Ending Gridcorts on",Sys.time())) | |
| brk | |
| } | |
| } |
Thanks Hakim for your answer. Maybe I do something wrong in the script because i Have this result:

and so I cannot see the images. Maybe you have an idea because I have this result ?
Thanks a lot Charlotte
Hello Hakim,
I have been looking for a solution like this. However, I am getting an error:
[1] "Start Gridcorts: 2021-06-27 20:51:27"
[1] "Loading parameters"
[1] "Done loading parameters"
[1] "Initiating loop operation"
==========Error in match.arg(alternative) : 'arg' must be of length 1
In addition: There were 50 or more warnings (use warnings() to see the first 50)
warnings()
Warning messages:
1: In cor(x, y) : the standard deviation is zero
2: In cor(x, y) : the standard deviation is zero
3: In cor(x, y) : the standard deviation is zero
4: In cor(x, y) : the standard deviation is zero
5: In cor(x, y) : the standard deviation is zero
6: In cor(x, y) : the standard deviation is zero
7: In cor(x, y) : the standard deviation is zero
8: In cor(x, y) : the standard deviation is zero
9: In cor(x, y) : the standard deviation is zero
10: In cor(x, y) : the standard deviation is zero
11: In cor(x, y) : the standard deviation is zero
12: In cor(x, y) : the standard deviation is zero
13: In cor(x, y) : the standard deviation is zero
14: In cor(x, y) : the standard deviation is zero
15: In cor(x, y) : the standard deviation is zero
16: In cor(x, y) : the standard deviation is zero
17: In cor(x, y) : the standard deviation is zero
18: In cor(x, y) : the standard deviation is zero
19: In cor(x, y) : the standard deviation is zero
20: In cor(x, y) : the standard deviation is zero
Can you point me in the right direction to resolve this?
Hi Hakim,
thank you very much for your code, it is amazing!
Here we calculate the correlation at time lag 0. I want to observe the time lag response and the maximum correlation at time lag = 0, 1, 2, 3, 4. Do you have an idea how to do this with raster brick data ?
thank you in advance
Warning in install.packages :
package ‘gridcorts’ is not available (for R version 3.6.3)
#while executing the package on data
Error in gridcorts(rasterstack = rstack, method = "pearson", type = "both") :
could not find function "gridcorts"
Timing stopped at: 0 0 0
Could you help me to solve this issue?
library (raster) library(spatial)library(rgdal)library(rgeos)library(sp)library(maptools)library(Kendall)`
setwd ("E:/Central University of Jharkhand/M.Sc dissertation")
D <- ("E:/Central University of Jharkhand/M.Sc dissertation/DEMClipped.tif")
DEM <- raster ("DEMClipped.tif")
Temp <- ("E:/Central University of Jharkhand/M.Sc dissertation/MAAT_Clipped.tif")
MAAT <- raster ("MAAT_Clipped.tif")
s <- stack (DEM, MAAT)
a <- length (MAAT)
b <- length (DEM)
#Slope Function
fun = function(x) {if (is.na(x[1])) else {lm(x[1] ~ x[2])$coefficients[2]}}
slope <- calc(s, fun)
I am using this code to run a linear regression between the temperature raster layer and DEM. But in slope, I am NA and NA as max and min values and thereafter a blank map when I am plotting the same. Please help! I need to calculate Lapse rate raster from it.
Hi,
I am excited to use this code. When I try to run the code with the sample data I can't get it to not give me NAs. Am I reading in the files incorrectly?
require(raster)
npp<-raster("C:/Users/folder/Downloads/gridcorts_data/npp.tif")
rainfall<-raster("C:/Users/folder/Downloads/gridcorts_data/rain.tif")
rstack <- stack(npp,rainfall)
cg1 <- gridcorts(rasterstack = rstack, method = "spearman",type="both")
I figured out I need to use the "stack" function to read in all the bands of the raster. The gridcorts function works now.
For example:
npp<-stack("C:/Users/folder/Downloads/gridcorts_data/npp.tif")
Thank you very much. Please tell me how to get the correlation image?
require(raster)
npp<-raster("C:/Users/User/OneDrive/Desktop/Corr/npp.tif")
rainfall<-raster("C:/Users/User/OneDrive/Desktop/Corr/rain.tif")
rstack <- stack(npp,rainfall)
gridcorts <- function(rasterstack, method, type=c("corel","pval","both")){
Values for (layers, ncell, ncol, nrow, method, crs, extent) come straight from the input raster stack
e.g. nlayers(rasterstack), ncell(rasterstack)... etc.
print(paste("Start Gridcorts:",Sys.time()))
print("Loading parameters")
layers=nlayers(rasterstack);ncell=ncell(rasterstack);
ncol=ncol(rasterstack);nrow=nrow(rasterstack);crs=crs(rasterstack);
extent=extent(rasterstack);pb = txtProgressBar(min = 0, max = ncell, initial = 0)
print("Done loading parameters")
mtrx <- as.matrix(rasterstack,ncol=layers)
empt <- matrix(nrow=ncell, ncol=2)
print("Initiating loop operation")
if (type == "corel"){
for (i in 1:ncell){
setTxtProgressBar(pb,i)
if (all(is.na(mtrx[i,1:(layers/2)])) | all(is.na(mtrx[i,((layers/2)+1):layers]))){
empt[i,1] <- NA
} else
if (sum(!is.na(mtrx[i,1:(layers/2)]/mtrx[i,((layers/2)+1):layers])) < 4 ){
empt[i,1] <- NA
} else
empt[i,1] <- as.numeric(cor.test(mtrx[i,1:(layers/2)], mtrx[i,((layers/2)+1):layers],method=method)$estimate)
}
print("Creating empty raster")
corel <- raster(nrows=nrow,ncols=ncol,crs=crs)
extent(corel) <- extent
print("Populating correlation raster")
values(corel) <- empt[,1]
print(paste("Ending Gridcorts on",Sys.time()))
corel
}
else
if (type == "pval"){
for (i in 1:ncell){
setTxtProgressBar(pb,i)
if (all(is.na(mtrx[i,1:(layers/2)])) | all(is.na(mtrx[i,((layers/2)+1):layers]))){
empt[i,2] <- NA
} else
if (sum(!is.na(mtrx[i,1:(layers/2)]/mtrx[i,((layers/2)+1):layers])) < 4 ){
empt[i,2] <- NA
} else
empt[i,2] <- as.numeric(cor.test(mtrx[i,1:(layers/2)], mtrx[i,((layers/2)+1):layers],method=method)$p.value)
}
pval <- raster(nrows=nrow,ncols=ncol,crs=crs)
extent(pval) <- extent
print("Populating significance raster")
values(pval) <- empt[,2]
print(paste("Ending Gridcorts on",Sys.time()))
pval
}
else
if (type == "both"){
for (i in 1:ncell){
setTxtProgressBar(pb,i)
if (all(is.na(mtrx[i,1:(layers/2)])) | all(is.na(mtrx[i,((layers/2)+1):layers]))){
empt[i,] <- NA
} else
if (sum(!is.na(mtrx[i,1:(layers/2)]/mtrx[i,((layers/2)+1):layers])) < 4 ){
empt[i,] <- NA
} else {
empt[i,1] <- as.numeric(cor.test(mtrx[i,1:(layers/2)], mtrx[i,((layers/2)+1):layers],method=method)$estimate)
empt[i,2] <- as.numeric(cor.test(mtrx[i,1:(layers/2)], mtrx[i,((layers/2)+1):layers],method=method)$p.value)
}
}
c <- raster(nrows=nrow,ncols=ncol,crs=crs)
p <- raster(nrows=nrow,ncols=ncol,crs=crs)
print("Populating raster brick")
values(c) <- empt[,1]
values(p) <- empt[,2]
brk <- brick(c,p)
extent(brk) <- extent
names(brk) <- c("Correlation","Pvalue")
print(paste("Ending Gridcorts on",Sys.time()))
brk
}
}
cg1 <- gridcorts(rasterstack = rstack, method = "spearman",type="both")
Hi,
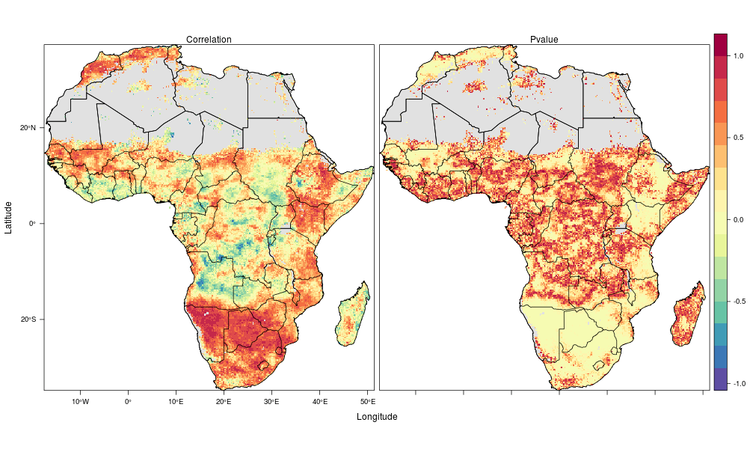
Thanks a lot for your code I want to do exactly that for temperature and NDWI. I just have a question concerning the two plots that you put on your blog.

Do you have the code for this? I am blocked with cg1 and now I don't know what to do ?
Thanks again : )