Last active
June 2, 2020 11:40
-
-
Save hddananjaya/5b9d567d00799e69552c53be82ced866 to your computer and use it in GitHub Desktop.
Postgres CITEXT vs TEXT performance
This file contains hidden or bidirectional Unicode text that may be interpreted or compiled differently than what appears below. To review, open the file in an editor that reveals hidden Unicode characters.
Learn more about bidirectional Unicode characters
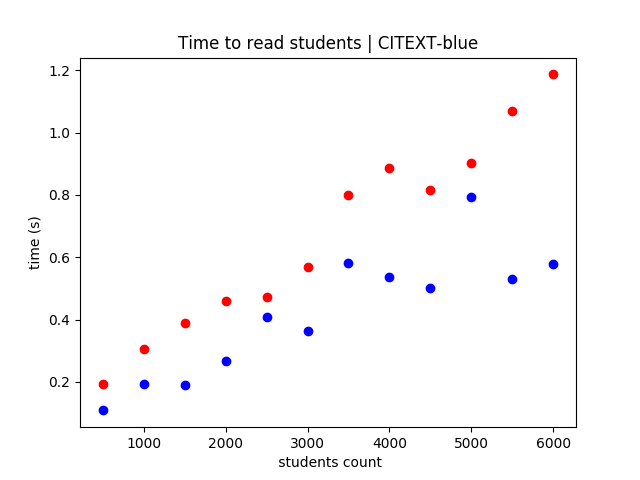
But this is what happened when selecting data from the course.

Code that I used for automating requests for selecting.
import os
import random
import string
import requests
import time


def randomString(stringLength=10):
    """Generate a random string of fixed length """
    letters = string.ascii_lowercase
    return ''.join(random.choice(letters) for i in range(stringLength))


cookies = {
    'userSession': 'eyJhbGciOiJIUzI1NiIsInR5cCI6IkpXVCJ9.eyJkaWQiOiJ1bnZlcmlmaWVkLTdiYjZkYmMwLTU5ZGMtMTFlYS1iZDliLTQxZmNkMDFhNjZmNSIsInR5cGUiOjAsInVzZXJSb2xlIjoiaXNzdWVyIiwiY29udGFjdCI6NiwicGVybWlzc2lvbnMiOlsidGVhY2hlcjpyZWFkIiwidGVhY2hlcjp3cml0ZSIsInN0dWRlbnQ6cmVhZCIsInN0dWRlbnQ6d3JpdGUiLCJhZG1pbiJdLCJpYXQiOjE1ODMxNDUyNDUsImV4cCI6MTU4NDM1NDg0NX0.eqXdWo-6wz6gJ4jmx6yAsC7mE3Npkaz4IUJD1QUhsr0',
    'intercom-session-bv38u4jk': 'cEFqeHlyM3ZGVnNtaVlJL05CN3YyTjRrdktnZzJDekFtTEZNanp5bzJMeVlaOUxzVXpxNG82OFFZdlZnOExudC0teWdOaFVGZG5rWlVDbjlqUFpwYmx4Zz09--7de7f1af77f832f6be644595e72a51e2d3dd0323',
}

headers = {
    'Connection': 'keep-alive',
    'Accept': 'application/json, text/plain, */*',
    'Origin': 'http://localhost:3000',
    'Sec-Fetch-Dest': 'empty',
    'User-Agent': 'Mozilla/5.0 (Linux; Android 6.0; Nexus 5 Build/MRA58N) AppleWebKit/537.36 (KHTML, like Gecko) Chrome/80.0.3987.87 Mobile Safari/537.36',
    'Content-Type': 'application/json;charset=UTF-8',
    'Sec-Fetch-Site': 'same-site',
    'Sec-Fetch-Mode': 'cors',
    'Referer': 'http://localhost:3000/courses/de33b7f0-59dc-11ea-bd9b-41fcd01a66f5/waiting',
    'Accept-Language': 'en-US,en;q=0.9',
}

time_pairs = []


def insertStudents ():
    time_list = []

    invites = []
    for i in range (500):
        invite_obj = {"email":"{}@{}.com".format(randomString(),randomString()) ,"phone":""}
        invites.append(invite_obj)

    data = str(invites).replace("'", "\"")

    start = time.time()
    response = requests.post('http://localhost:5000/api/courses/de33b7f0-59dc-11ea-bd9b-41fcd01a66f5/students', headers=headers, cookies=cookies, data=data)
    # print (response.content)
    print (response.status_code)
    done = time.time()
    elapsed = done - start
    time_list.append(elapsed)
    print ('=======================================================')
    print ('time to add {} students = {}'.format(500, elapsed))
    print ('=======================================================')


def readTheCourse ():
    start = time.time()
    response = requests.get('http://localhost:5000/api/courses/de33b7f0-59dc-11ea-bd9b-41fcd01a66f5', headers=headers, cookies=cookies)
    print (response.status_code)
    done = time.time()
    elapsed = done - start
    print ('=======================================================')
    print ('time to read  students = {}'.format(elapsed))
    print ('=======================================================')
    return elapsed

std_count = 500
for i in range (12):
    sc = insertStudents()
    rt = readTheCourse()
    time_pairs.append([std_count, rt])
    std_count += 500

print (time_pairs)
Code for the plotting
# TEXT - TIME TO READ 500 * 5 USERS
# a1 = [[500, 0.34286046028137207], [1000, 0.47170305252075195], [1500, 0.3104379177093506], [2000, 0.682849645614624], [2500, 0.4806191921234131], [3000, 0.5650701522827148], [3500, 0.7414286136627197], [4000, 1.105724573135376], [4500, 0.7980315685272217], [5000, 0.800025463104248], [5500, 0.9555141925811768], [6000, 1.2277131080627441]]
# a2 = [[500, 0.13019156455993652], [1000, 0.263568639755249], [1500, 0.3995523452758789], [2000, 0.4489591121673584], [2500, 0.47824621200561523], [3000, 0.5015416145324707], [3500, 0.6623961925506592], [4000, 0.7547996044158936], [4500, 0.9457859992980957], [5000, 0.991969108581543], [5500, 1.1358506679534912], [6000, 1.2357127666473389]]
# a3 = [[500, 0.1408100128173828], [1000, 0.29343199729919434], [1500, 0.4946134090423584], [2000, 0.32529330253601074], [2500, 0.4150521755218506], [3000, 0.615856409072876], [3500, 0.6550290584564209], [4000, 1.0073726177215576], [4500, 0.7512013912200928], [5000, 0.9377298355102539], [5500, 1.0177783966064453], [6000, 1.0712096691131592]]
# a4 = [[500, 0.16573071479797363], [1000, 0.19810247421264648], [1500, 0.3581531047821045], [2000, 0.3840639591217041], [2500, 0.5157613754272461], [3000, 0.5872955322265625], [3500, 1.1438641548156738], [4000, 0.6829550266265869], [4500, 0.7732465267181396], [5000, 0.8749711513519287], [5500, 1.16654634475708], [6000, 1.2111494541168213]]

# CITEXT
# a1 = [[500, 0.09650850296020508], [1000, 0.1687312126159668], [1500, 0.16428780555725098], [2000, 0.24415826797485352], [2500, 0.25140881538391113], [3000, 0.44766926765441895], [3500, 0.8470873832702637], [4000, 0.3614680767059326], [4500, 0.4939579963684082], [5000, 0.5424118041992188], [5500, 0.5474159717559814], [6000, 0.5735747814178467]]
# a2 = [[500, 0.13007211685180664], [1000, 0.1435530185699463], [1500, 0.15303421020507812], [2000, 0.37621521949768066], [2500, 0.2706887722015381], [3000, 0.3150627613067627], [3500, 0.3207244873046875], [4000, 0.9831936359405518], [4500, 0.4183931350708008], [5000, 0.5881309509277344], [5500, 0.5477564334869385], [6000, 0.5795495510101318]]
# a3 = [[500, 0.10593080520629883], [1000, 0.3265695571899414], [1500, 0.21654129028320312], [2000, 0.2338113784790039], [2500, 0.8468258380889893], [3000, 0.34406542778015137], [3500, 0.3827545642852783], [4000, 0.42885565757751465], [4500, 0.6385164260864258], [5000, 1.6137914657592773], [5500, 0.506544828414917], [6000, 0.6388683319091797]]
# a4 = [[500, 0.10300540924072266], [1000, 0.13686919212341309], [1500, 0.22192788124084473], [2000, 0.21599149703979492], [2500, 0.26786327362060547], [3000, 0.3512897491455078], [3500, 0.7787292003631592], [4000, 0.3783097267150879], [4500, 0.45909547805786133], [5000, 0.42559170722961426], [5500, 0.5210475921630859], [6000, 0.5187411308288574]]


# avgs = []
# d = 500
# for i in range(len(a1)):
#     av = (a1[i][1] + a2[i][1] + a3[i][1] + a4[i][1]) / 4
#     avgs.append((d, av))
#     d += 500

# print (avgs)


import matplotlib.pyplot as plt
import numpy as np

avg_citext = [(500, 0.1088792085647583), (1000, 0.1939307451248169), (1500, 0.18894779682159424), (2000, 0.26754409074783325), (2500, 0.409196674823761), (3000, 0.3645218014717102), (3500, 0.5823239088058472), (4000, 0.5379567742347717), (4500, 0.502490758895874), (5000, 0.7924814820289612), (5500, 0.5306912064552307), (6000, 0.5776834487915039)]
avg_text = [(500, 0.19489818811416626), (1000, 0.30670154094696045), (1500, 0.3906891942024231), (2000, 0.4602915048599243), (2500, 0.47241973876953125), (3000, 0.567440927028656), (3500, 0.8006795048713684), (4000, 0.8877129554748535), (4500, 0.8170663714408875), (5000, 0.9011738896369934), (5500, 1.0689224004745483), (6000, 1.1864462494850159)]


for i in avg_citext:
    plt.plot(i[0], i[1], 'bo', color='b')

for i in avg_text:
    plt.plot(i[0], i[1], 'bo', color='r')


plt.xlabel(' students count')
plt.ylabel('time (s)')
plt.title('Time to read students | CITEXT-blue')
plt.show()
Sign up for free
to join this conversation on GitHub.
Already have an account?
Sign in to comment
So you reached here and you already know that there is a performance issue with CITEXT in postgres! I had to measure it. So I simulated db insertion from the user's end by just automating a POST request using python. If you wanna convert your browser request to python request, go to network tab and copy as CURL, then convert CURL command to Python using https://curl.trillworks.com/.
I did and this was the result for inserting students to course, which is one of our features that we wanted to check.
This is the code that I used to automate requests.
and I drew the graph using this.