
Last active
March 17, 2022 19:30
-
-
Save helgasoft/3168aa00a703b5f7e8c3cfa8ad8bf25b to your computer and use it in GitHub Desktop.
R | ECharts | sankey chart with node colors
This file contains hidden or bidirectional Unicode text that may be interpreted or compiled differently than what appears below. To review, open the file in an editor that reveals hidden Unicode characters.
Learn more about bidirectional Unicode characters
| sankey <- data.frame( | |
| stringsAsFactors = TRUE, | |
| source = c("Objetivo 1", | |
| "Objetivo 2","Objetivo 3","Objetivo 4", | |
| "Objetivo 1","Objetivo 2","Objetivo 3", | |
| "Objetivo 4","Objetivo 1","Objetivo 2","Objetivo 3", | |
| "Objetivo 4","Objetivo 1","Objetivo 2", | |
| "Objetivo 3"), | |
| target = c("ODS 17: Alianzas para lograr los objetivos", | |
| "ODS 10: Reducción de las desigualdades", | |
| "ODS 10: Reducción de las desigualdades", | |
| "ODS 17: Alianzas para lograr los objetivos", | |
| "ODS 3: Salud y bienestar", | |
| "ODS 12: Producción y consumo responsables", | |
| "ODS 12: Producción y consumo responsables", | |
| "ODS 9: Industria, innovación e infraestructura", | |
| "ODS 8: Trabajo decente y crecimiento económico", | |
| "ODS 8: Trabajo decente y crecimiento económico", | |
| "ODS 8: Trabajo decente y crecimiento económico", | |
| "ODS 8: Trabajo decente y crecimiento económico", | |
| "ODS 9: Industria, innovación e infraestructura", | |
| "ODS 9: Industria, innovación e infraestructura", | |
| "ODS 9: Industria, innovación e infraestructura"), | |
| value = c(1L,3L,1L, | |
| 1L,1L,3L,1L,1L,19L,1L,11L,13L,10L,8L, | |
| 1L)) | |
| colors = c("#9F2241","#691C32","#235B4E","#10312B","#DDC9A3","#BC955C") | |
| nodes <- list(); i <- 1; | |
| for(n in unique(c(sankey$source, sankey$target))) { | |
| nodes <- append(nodes, list(list(name=n, itemStyle=list(color=colors[i])))) | |
| i <- i+1 | |
| } | |
| edges <- lapply(ec.data(sankey, 'names'), function(x) { | |
| x$value = as.numeric(x$value) | |
| x$lineStyle = list(color='gradient', opacity=.3) | |
| x | |
| }) | |
| library(echarty) | |
| p <- ec.init() | |
| p$x$opts <- list( | |
| series = list(list(type='sankey', data=nodes, edges=edges)) | |
| ) | |
| p | |
| #' Warning: a dragging bug in ECharts v.5 when using 'nodes' instead of equivalent 'data' attribute. 'data' works as expected. | |
| #' https://github.com/apache/echarts/issues/13866 |

Author
Author
sankey with tooltips, inquiry by @tyluRp
df <- data.frame(
	source = c("start", "start", "start", "start", "start"),
	target = c("node1", "node2", "node3", "node4", "node5"),
	value = round(c(2 / 3, 1 / 9, 1 / 9, 1 / 18, 1 / 18), 2),
	desc = "foo",
	stringsAsFactors = FALSE
)

library(echarty)    # v.1.4.4+ required
p <- ec.init()
p$x$opts <- list(
	series = list(list(type= 'sankey',
	   nodes = lapply(lapply(unique(c(df$source, df$target)), list), setNames, 'name'),
	   edges = ec.data(df, 'names'))),
	tooltip= list(formatter= ec.clmn('v:%@<br>d:%@', 'value', 'desc'))
)
p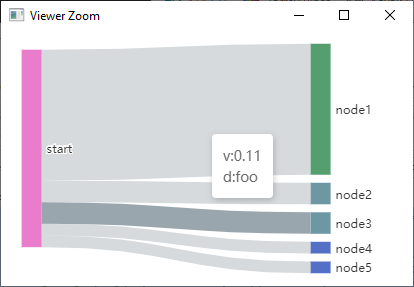
Sign up for free
to join this conversation on GitHub.
Already have an account?
Sign in to comment
data by @Jorge-hercas, chart made with echarty